
James Amoo, Community Partner
Feb 19, 2026

Most growth teams eventually find themselves debating Mixpanel vs Google Analytics. It is one of the most common comparisons in the SaaS world, usually driven by a desire to consolidate tools and cut costs. The assumption is that you need to pick a winner: either you bet on Google’s ecosystem for everything, or you switch entirely to a dedicated product analytics tool like Mixpanel.
However, treating this as a binary choice is a strategic mistake. The most successful early-to-mid-stage SaaS companies rarely choose one over the other. Instead, they recognize that these tools serve fundamentally different stages of the analytics lifecycle. The goal should be to build a unified data stack where marketing data and product usage data speak to each other, giving you a complete view of the user journey from the first click to the thousandth login.
In this blog post, we’ll discuss Mixpanel vs Google Analytics 4 and show you how to get the best of both worlds by integrating both tools for a unified data analysis.
GA4 vs Mixpanel: why you need both
First, growth teams must move past the comparison of GA4 vs Mixpanel and recognize that data integration is the correct strategic approach. It’s like trying to compare apples to oranges. While there is some feature overlap (like GA4’s event-based tracking and Mixpanel’s attribution features), their core competencies remain distinct.
Google Analytics 4 (GA4) is the standard for acquisition. It excels at tracking anonymous web traffic, session-based activity, and conversion tracking. It answers questions like, "Where are my visitors coming from?" and "Which landing pages drive the most signups?" Its data model is built around the session and the marketing source.
Mixpanel is the standard for engagement and retention. It excels at tracking identified users, cohort analysis, and granular feature usage. It answers questions like, "Did the users who signed up actually use the core feature?" and "What is the retention rate of users who onboarded via the mobile app?"
If you depend solely on analytics from GA4, you often lose visibility the moment a user signs up and enters your product. You get high-level event counts, but deep funnel analysis and user-level granularity are difficult to access. Conversely, if you rely solely on Mixpanel, you often lack the rich top-of-funnel attribution data that full-funnel marketing teams need to optimize ad spend.
Why is integration difficult for teams?
If the best approach is to use both, why do so many teams struggle to get a unified view? The answer lies in the technical friction between the two platforms and finding a tool that supports this integration.
The primary disconnect is the Google Analytics data model. Despite GA4’s shift toward events, it still relies heavily on sessions and anonymous identifiers (cookies and device IDs) to track visitors. Mixpanel, on the other hand, is user-centric. It relies on a distinct User ID (usually your internal database ID) to stitch events together across devices and time.
This creates an identity resolution challenge. For example, GA4 identifies a user as "Device ID 123 from a Facebook Ad." Mixpanel identifies that same user as "User ID 456 who invited three teammates." Without a mechanism to bridge these identities, you end up with a data silo.
This silo creates a massive blind spot. You might know that LinkedIn Ads drive cheap traffic (via GA4), and you might know that your "Power Users" have a high lifetime value (via Mixpanel). But without integrating the data, you cannot answer the critical question: "Which marketing channel is driving the users who actually become Power Users?"
Native integrations between Google Analytics vs Mixpanel are often limited. They might pass basic UTM parameters into Mixpanel, but they rarely support complex, retrospective analysis. To get true answers, you need to join the raw data from both sources using a dedicated tool that truly understands the context of your data.
Leveraging Quadratic as the unification layer
Quadratic serves as this agile unification layer for data blending from Mixpanel and Google Analytics. It is an AI-powered spreadsheet that bridges the gap between the rigid heavy stack and the limitations of traditional spreadsheets like Excel or Google Sheets. Let’s explore some of its key features in detail:
Data integration
In a traditional spreadsheet, importing millions of rows from APIs and joining them to get real-time Google Analytics data in Microsoft Excel is nearly impossible. Quadratic connects directly to multiple databases, raw data, and APIs. It provides a centralized and unified environment where users can gain insights from different data sources.
It allows you to connect to GA4 and Mixpanel simultaneously within a single Google Analytics spreadsheet workspace. The data connection also remains live, meaning the AI dashboard GA4 updates automatically as new data flows into GA4 and Mixpanel.
Support for modern programming languages
Quadratic also functions as a coding spreadsheet that supports programming in Python, SQL, and JavaScript. This means that you can perform the complex "joins" that usually happen in a data warehouse right in your spreadsheet. You can pull your acquisition data into one sheet and your product event data into another. Then, using Python and SQL, you can join these datasets and generate insights from them.
AI data analysis and visualization
Integrating GA4 and Mixpanel data can increase the time spent generating insights, especially for non-technical teams. With Quadratic’s built-in AI spreadsheet analysis feature, teams can generate insights from this integration simply by asking questions using natural language queries.
This approach democratizes your data. You don't need to request a new ETL pipeline to ask a new question. You simply adjust your query in the spreadsheet. It provides an environment where marketing and product teams can look at the same numbers, offering the best user analytics for product teams to ensure that the definition of a conversion is consistent across the board.
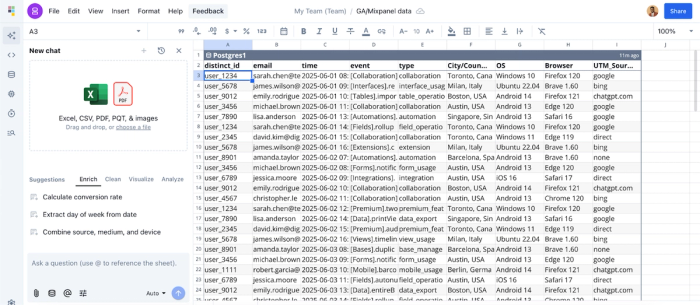
Let’s see an example of this. First, I connect to a sample Mixpanel data (and GA4 in a separate sheet):
Then I ask Quadratic AI, “Which acquisition channels provide the highest number of users?” Here:
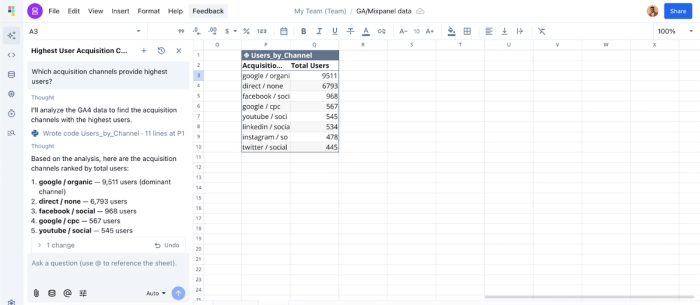
Quadratic returned a table that shows a breakdown of the highest users based on acquisition channel.
We can also generate interactive visualizations by using text prompts. For example, let’s ask Quadratic to visualize this data:
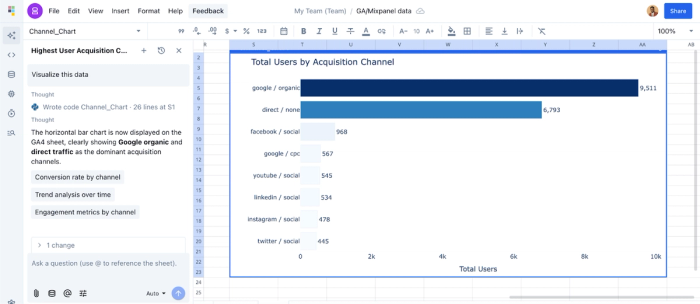
Quadratic instantly returned a chart that visualizes our data for easy communication. All you have to do is describe how you want to present your data, and Quadratic automatically chooses the best chart type based on your dataset.
Collaboration
When working with integrations, especially those that bridge marketing and product data, tight collaboration is essential. Both teams need visibility into how datasets are joined, the ability to navigate the data exploration process independently, and a shared understanding of how insights are generated.
Quadratic provides a collaborative analytics platform, allowing teams to work in the same environment, remove reporting bottlenecks, and accelerate decision-making. Insights can be easily shared with stakeholders.
Conclusion
The debate surrounding Mixpanel vs Google Analytics is a distraction from the real work of growth. The most effective analytics strategy does not force you to choose between acquisition visibility and product depth. It embraces both.
By using a tool like Quadratic as your middle layer, you can avoid the complexity of enterprise data warehousing while still gaining the strategic advantage of unified data. You can prove exactly how marketing spend impacts product retention and ensure that your entire organization is making decisions based on the same reality.
Connect your GA4 and Mixpanel data to Quadratic and build the best dashboards for customer journey analysis in minutes (then share it with your team). Try Quadratic for free today.
Frequently asked questions (FAQs)
What is the main difference between Mixpanel and Google Analytics?
Mixpanel focuses on event-based product analytics, helping teams track user actions, feature usage, and retention. Google Analytics is primarily designed for marketing and web traffic analysis, tracking page views, acquisition channels, and conversions. Many teams use both to cover product and marketing insights.
How does Quadratic unify Mixpanel and Google Analytics data?
Quadratic provides connections to Mixpanel, Google Analytics, databases, and APIs, pulling live data into a single AI-powered spreadsheet. This allows teams to analyze product events and marketing performance together in one workspace.
Is Quadratic better than exporting data into Excel or Google Sheets?
Yes. Unlike static spreadsheets, Quadratic maintains live data connections, handles large datasets efficiently, and supports advanced analytics using SQL, Python, and AI, eliminating manual updates and performance issues.