
James Amoo, Community Partner
Feb 19, 2026

In the modern data stack, data analysis using SQL remains the industry standard for a simple reason: it provides the most direct access to your organization's source of truth. While tools like Python and R offer advanced statistical capabilities, and spreadsheets offer flexibility, SQL (Structured Query Language) is the universal language for pulling, shaping, and understanding raw data stored in relational databases.
The primary value of SQL data analytics is not just in retrieving numbers, but in creating an auditable trail of how those numbers were derived. When analysis relies on ad-hoc spreadsheet exports, version control becomes a herculean task. A static CSV file sitting in a downloads folder has no history; you cannot see the logic that filtered the rows or aggregated the totals.
In contrast, SQL analytics is based on writing code. It can be reviewed, versioned, and debugged. Bad analysis often isn't the result of syntax errors, but of logic errors that go undetected because the process wasn't transparent. When you shift your mindset from pulling data to building a repeatable data product, you ensure that stakeholders can trust the numbers you deliver.
In this blog post, we’ll discuss SQL data analytics, exploring ways to build trustworthy data analysis workflows using SQL.
Exploratory data analysis (EDA) and validation
The most critical step in SQL analysis happens before you attempt to answer the specific question for business data analysis. You must validate that the data behaves the way you expect it to. Skipping this phase is the leads to the existence of metrics that look correct on the surface but still require a high degree of data cleaning. To effectively perform this, Exploratory Data Analysis should always begin with validation checks.
Before joining tables, verify the grain of your data. Use COUNT(DISTINCT column) compared against COUNT(*) to ensure that your primary keys are actually unique. If a table you expect to be unique at the user_id level actually contains duplicates, any subsequent joins will explode your row counts and inflate your revenue metrics.
Next, identify NULLs and anomalies in critical fields. Unexpected NULL values in timestamps or category columns can silently drop rows when you apply filters or aggregations, which is why you must clean messy spreadsheet data early on. Running simple profiling queries to check the distribution of values helps you spot outliers, such as a "test" user account with a million transactions that could skew your averages.
Finally, perform reconciliation. This is a sanity check where you compare your query results against a known baseline. For example, does the total revenue in your query match the finance team’s finalized report from last month? If the numbers don't align during this phase, no amount of complex modeling later will save the analysis.
Structuring queries for reusability and performance
Writing SQL that works is easy; writing SQL that a colleague can understand and reuse six months from now is a skill. To treat SQL for analytics as a robust workflow, you need to adopt best practices for writing SQL queries that prioritize readability and performance.
One of the most effective ways to improve readability is by using Common Table Expressions (CTEs) instead of nested subqueries. CTEs allow you to break complex logic into linear, logical steps (e.g., WITH cleaned_data AS..., calculated_metrics AS...). This makes it significantly easier to debug specific parts of the query and helps other analysts understand the flow of data transformation.
Performance is also part of the user experience. If a dashboard takes ten minutes to load, stakeholders will stop using it. Optimize your SQL data analysis tools by filtering data as early as possible. Applying WHERE clauses to limit the time range or scope before joining large tables reduces the computational load on the database and keeps the analysis interactive.
For trend analysis, rely on window functions like LAG, LEAD, and RANK. These are essential tools that allow you to calculate month-over-month growth, running totals, or moving averages without resorting to complex and slow self-joins.
Lastly, comment on your code. Trustworthy analysis requires context. A comment explaining why you filtered out a specific SKU or used a specific logic for churn is just as important as the code itself.
The last mile problem: integrating SQL and spreadsheets
A major friction point in analytics is the disconnect between data analysis using Excel and SQL. The typical workflow involves a data analyst writing a sophisticated SQL query, exporting the results to a CSV, and then pasting that data into a spreadsheet for final Excel formatting and visualization, despite studies show that up to 90% of all spreadsheets contain errors.
This "export" step is where trust often breaks down. The moment it is exported, it becomes stale data. It creates a snapshot that is immediately out of sync with the live database. Furthermore, this workflow encourages shadow analytics, where critical business logic lives in hidden spreadsheet formulas applied to that static export.
If a stakeholder asks to see the data updated for the current week, the analyst has to repeat the entire manual loop: run query, export, copy-paste, and hope the formulas expand correctly. This manual intervention invites human error and makes the analysis brittle. The ideal state for data analytics with SQL and Excel workflows is to keep the SQL connection live, similar to how you might have excel connect to sql server, while retaining the flexible interface of a spreadsheet for the final presentation.
How Quadratic unifies data analysis using SQL
Quadratic solves the Last Mile problem by providing a unified SQL spreadsheet where data analysis using SQL happens directly alongside Python and formulas. Instead of choosing between an IDE for data analysis and a spreadsheet, you get both in a centralized environment. Let’s explore how Quadratic helps to streamline SQL data analytics:
Direct connections to databases
In Quadratic, you connect directly to live databases like Postgres, MySQL, or Snowflake. You write your SQL queries directly into the spreadsheet cells. The data is pulled live from the source, eliminating the need for manual CSV exports.
Since SQL lives in the grid, the analysis is inherently reproducible; anyone who opens the file sees the exact code used to generate the numbers. This makes Quadratic one of the best data analytics platforms for SQL and Python integration.
AI for data analysis and visualization
Quadratic includes built-in AI spreadsheet analysis that allows users to analyze data using natural language queries. Instead of writing complex queries from scratch, teams can ask questions like “Which feature has the highest adoption this month?” to track feature adoption metrics, or “Show churn by cohort as a line chart”.
Quadratic instantly generates tables, calculations, and visualizations while keeping the underlying logic visible and editable. The AI acts as an accelerator, helping teams move faster without sacrificing transparency. Let’s see how this works.
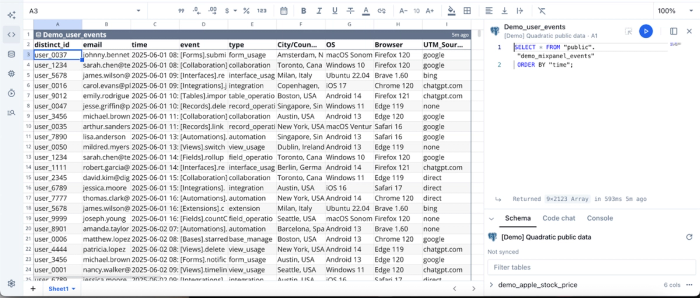
First, I connect to a sample Postgres data using SQL in Quadratic:
Now that we’ve connected to a live data source using SQL, we can then analyze our data using Python. I ask Quadratic to “Create a chart to show OS usage distribution.” Here:
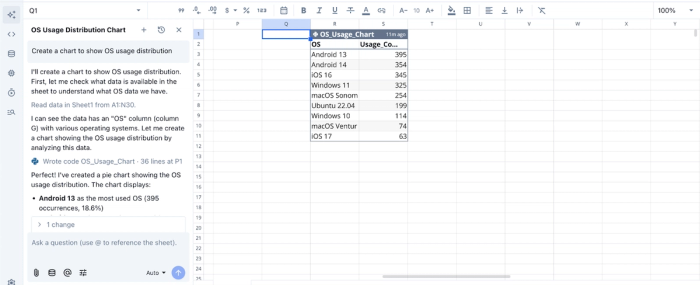
Quadratic returns a table showing the breakdown of the OS usage distribution. Visualization in Quadratic can also be done using text prompts. We can simply ask Quadratic to “Visualize the OS usage distribution”:
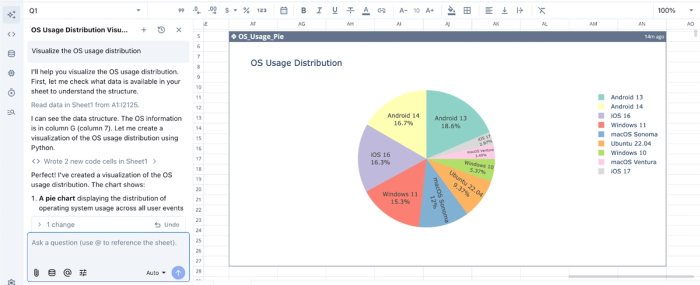
Quadratic instantly generates an interactive and customizable visualization based on our text prompts. It intelligently chooses the best chart type based on your dataset.
Native support for modern programming languages
Being a coding spreadsheet, Quadratic supports Python and traditional spreadsheet formulas side by side. This allows teams to perform data modeling, run cohort analysis, and build complex data transformations in Python.
For example, a SQL query can pull raw usage data, Python can calculate churn or lifetime value for customer data analysis, and formulas can cross-check totals, all within the same worksheet. This approach combines the rigor of data engineering with the flexibility of spreadsheets.
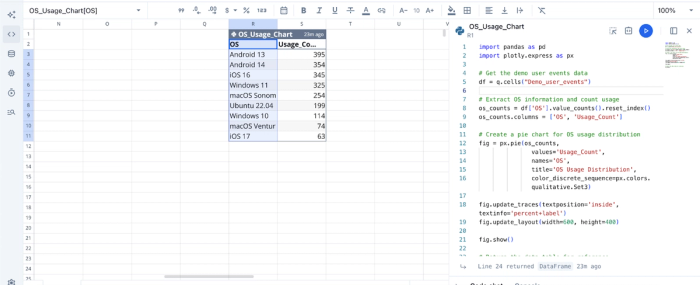
Here’s the code equivalent of the AI analysis we ran earlier:
This flexibility allows technical users to explore and implement more personalized analyses on their dataset, far surpassing basic ai tools for excel data analysis.
Collaboration
Unlike traditional analytics stacks where logic is hidden in dashboards or scattered across scripts, Quadratic keeps everything visible and shareable. Teams can review Python and SQL together, analyze data simultaneously, and share live dashboards seamlessly
This removes knowledge silos, promotes data accessibility across the organization, and builds confidence in reported numbers.
Conclusion
The true value of SQL in data analysis isn't just about syntax; it is about creating insights that are accurate, auditable, and enduring. By focusing on validation, clean code structure, and eliminating brittle manual exports, you move from answering ad-hoc questions to building trusted data assets.
SQL data analytics is most powerful when it isn't trapped in a silo or a static export. It should be a living part of your decision-making process.
Connect your database to Quadratic and build a reusable SQL analysis and dashboard your team can share. Try Quadratic for free today.
Frequently asked questions (FAQs)
What is the primary benefit of SQL data analytics?
SQL provides direct, auditable access to an organization's source of truth, making it the industry standard for trusted analysis. Unlike static spreadsheet exports, SQL-based analysis is code that can be reviewed, versioned, and debugged, ensuring the numbers delivered are accurate and transparent.
Why is exploratory data analysis using SQL crucial?
Exploratory data analysis using SQL is vital for validating data behavior before deeper analysis. It involves checks like verifying primary key uniqueness, identifying NULLs and anomalies, and reconciling results against known baselines. By performing thorough SQL analysis at this stage, you ensure the foundational data is sound and reliable.
How does Quadratic enhance data analysis using SQL and Excel workflows?
Quadratic solves the "last mile" problem by unifying SQL, Python, and spreadsheet functionalities in a single environment. It allows users to write SQL queries directly in cells, connecting live to databases and eliminating the need for manual CSV exports.
What is SQL used for in data analysis to overcome common challenges?
SQL is used in data analysis to build trustworthy, repeatable insights and overcome the limitations of manual processes. It provides a transparent, auditable trail for how data is transformed, unlike ad-hoc spreadsheet exports that quickly become stale and lack version control.