
James Amoo, Community Partner
Feb 23, 2026

Businesses today possess more raw information than ever before, yet many teams still struggle with stale data and a fundamental mistrust of their own metrics. While the volume of data has exploded, the ability to turn that data into clear insights and compelling data stories hasn't kept pace. Effective business data analysis expands the basics of generating pretty charts or complex models; it is mainly about empowering teams to reduce risk, democratize data accessibility, and enable confident decision-making.
When analysis fails, it rarely fails because of a lack of mathematical rigor. It fails because of undefined metrics, hidden logic, and poor communication between stakeholders.
In this guide, we will explore business data analysis, identify the specific pitfalls that derail projects, and offer actionable strategies to build a reliable and transparent reporting workflow.
What is business data analysis?
At its core, business data analysis is the discipline of identifying business needs and determining solutions to business problems through data-driven insights. It is the bridge between raw operational data and strategic action. While the tools may vary, the primary goal remains consistent: converting information into actionable directives that improve performance, often referred to as last-mile analytics.
It is important to distinguish between ad-hoc analysis and business intelligence. Ad-hoc analysis typically involves answering specific, immediate questions (e.g., "Why did sales dip last Tuesday?"). It is often performed by an analyst exploring data flexibly.
Business intelligence, on the other hand, usually refers to the ongoing monitoring of established metrics through standardized dashboards. Both fall under the umbrella of data analysis business practices, but they require different workflows and speeds.
Effective data analysis for business demands a deep understanding of the organizational context and the right skills for data analyst success.
The four types of analytics
To understand how data drives decisions, it helps to categorize the depth of the analysis. These four types represent a progression from hindsight to foresight, often described as the maturity model for business analytics, data analysis, and decision making.
- Descriptive: What happened? This is the foundation of most reporting, looking at historical data to summarize past performance (e.g., monthly revenue reports).
- Diagnostic: Why did it happen? This involves drilling down into the data to find root causes, correlations, and anomalies (e.g., investigating a sudden spike in customer churn).
- Predictive: What is likely to happen? Predictive analytics leverages data modeling to analyze historical trends and statistical models to forecast future outcomes (e.g., projecting inventory needs for Q4).
- Prescriptive: What should we do about it? The most advanced stage, where analysis suggests specific actions to optimize outcomes (e.g., dynamic pricing algorithms).
Common pitfalls in business data analysis
Despite the availability of advanced tools, many analysis projects end in confusion or wrong insights. The root causes often have less to do with the data itself and more to do with process and definition.
In this section, we’ll discuss the common pitfalls that data analysts face in generating insights from their business data.
Undefined metrics
One of the most common sources of chaos is the lack of a structured definition of business metrics. If finance defines "gross margin" differently from the sales team, any report combining those views will lead to discrepancies rather than insights.
When metrics are not rigorously defined and agreed upon upfront, business analyst data analysis efforts are wasted on reconciling numbers rather than solving problems.
The black box problem
Trust is easily eroded when stakeholders cannot see the work behind the numbers. In many workflows, data is extracted, manipulated in a local spreadsheet or a hidden script, and then pasted into a static slide.
If a stakeholder asks, "How was this calculated?" and the answer is buried in an inaccessible file, trust becomes a problem. This black box approach prevents teams from auditing logic and validating assumptions.
Siloed context
Analysis frequently happens in isolation. An analyst might pull data without knowing that a specific marketing campaign was paused that week, leading to misinterpretation of the results. When the context (operational knowledge) is siloed away from the code and data, the resulting insights often miss the mark.
Strategies for confident decision-making
To get more clarity on business data, teams need to adopt workflows and build a solid data infrastructure and analytics strategy that prioritizes alignment and visibility. These strategies apply whether you are conducting data analysis for small business operations or managing enterprise-level reporting.
Here are some practical tips on how to optimize your business data analysis for confident decision-making:
Align on definitions first
Before writing a single line of SQL for data analysis, ensure there is consensus on what you are measuring. Gather stakeholders to define key performance indicators (KPIs) in plain language. Documenting these definitions prevents the metric drift that occurs when different departments calculate the same metric in slightly different ways.
Prioritize data transparency
Build trust by showing your work. Modern business intelligence and data analysis workflows should allow stakeholders to audit the logic if they choose. When the data transformation steps are visible and accessible, the conversation shifts from "Is this number right?" to "What does this number tell us?" Transparency turns skeptics into collaborators.
Iterative analysis
Avoid the big reveal. Instead of working in a cave for two weeks to produce a perfect final report, share early findings and drafts. An iterative approach allows stakeholders to correct course early ("Oh, that data source excludes our new product line") and ensures the final output actually answers the business question.
Iterative analysis requires collaborative analytics tools that enable users share their findings on business data seamlessly.
Choose the right scope
Not every question requires a complex data warehouse solution. For agile teams, lightweight tools that allow for quick data exploration are often superior to rigid enterprise stacks. Knowing when to use a flexible, environment versus a locked-down dashboard is a key skill in managing analysis resources efficiently.
How Quadratic streamlines business data analysis
Quadratic addresses these challenges by bridging the gap between flexible, ad-hoc spreadsheets and rigid data engineering tools. It provides a unified workspace where data analysis for business intelligence becomes a transparent and team-based activity.
Live data connection
Decisions should be based on the current state of your dataset, not a CSV export from last week. Quadratic connects directly to databases, APIs, and raw data. This ensures that your analysis is always fed by live data, reducing the risk of making decisions based on stale information.
AI for data analysis and business intelligence
For users who are not skilled in coding or writing complex formulas, Quadratic’s built-in AI spreadsheet analysis feature allows natural language querying for insight generation. Users can ask questions about their data and generate insights instantly.
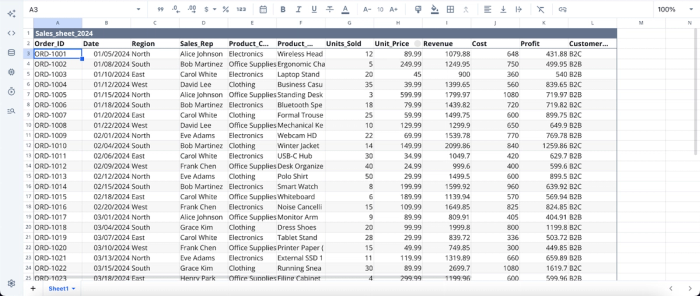
The first step to performing business data analysis in Quadratic is to import (or connect to) your data:
After importing your data, you can start generating insights right away. Simply ask a question, and Quadratic automatically writes the Python code needed to analyze it. Suppose we want to get insights into the most profitable products:
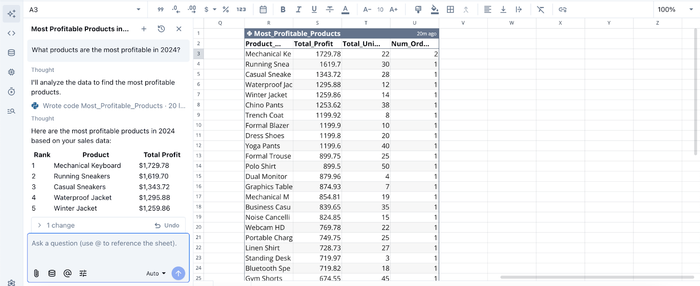
Here, I ask Quadratic AI, “What products are the most profitable in 2024?” and it instantly generates a table, ranking the most profitable products in descending order. This approach eliminates the technical barrier and allows users to fully understand their data.
AI-powered data visualization
Data visualization is an important step in the data analytics lifecycle, as it helps analysts better communicate their findings to stakeholders. However, most teams often skip this step, often due to limited expertise or the time required to switch between multiple data visualization tools.
Quadratic eliminates this barrier. It serves as an all-in-one platform for both data analysis and visualization, even for users without technical backgrounds. Powered by AI, users can simply describe how they want their data presented, and Quadratic automatically generates the most appropriate chart type based on their data. Let’s see how this works:
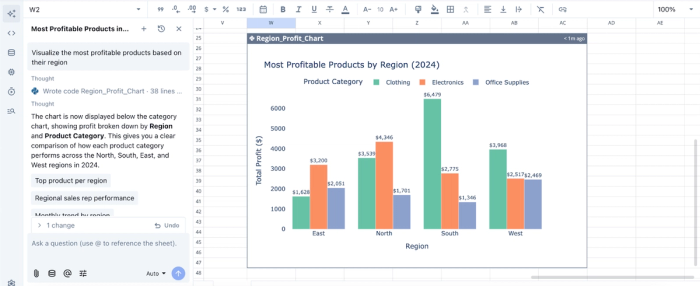
Here, I ask Quadratic AI to “Visualize the most profitable products based on their region,” and it instantly creates a chart based on that prompt.
Native support for modern programming languages
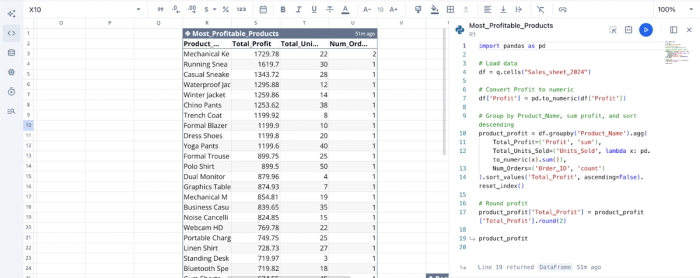
Unlike traditional spreadsheets like Excel and Google Sheets, Quadratic allows teams to use Python and SQL directly in the grid. This makes data transformations readable and auditable. This is particularly useful for technical users who want to move beyond the shores of spreadsheet formulas to perform more complex analysis.
This approach also provides users with a fully transparent logic. A stakeholder can look at a cell and see the exact SQL query or Python script that generated the value, eliminating the black box problem. Here’s the code equivalent of the analysis we conducted earlier:
Real-time collaboration
Quadratic is built for real-time collaboration. Teams can work together in the same file, defining metrics, writing queries, and visualizing data simultaneously. This multiplayer capability fosters alignment, as stakeholders can watch the analysis unfold and contribute their operational context in real time.
Conclusion
Making confident data decisions from business data analysis goes far beyond data accessibility. It requires a process that eliminates ambiguity and fosters trust. By recognizing the pitfalls of undefined metrics and opaque reporting, teams can build a culture where analysis is transparent, collaborative, and reliable. Success lies in bringing the logic out of the shadows and inviting stakeholders into the workflow.
Quadratic allows you to seamlessly generate insights by leveraging LLMs for data analysis. With full visibility into each logic, users can trust and make confident decisions based on the insights generated, and then automatically visualize those insights for easy communication. Try Quadratic for free today.
Frequently asked questions (FAQs)
What are the challenges in business data analysis and decision-making?
Many business data analysis projects falter due to undefined metrics, opaque black box calculations, and siloed operational context. These issues prevent stakeholders from trusting the numbers and hinder effective business analyst data analysis, leading to analysis paralysis rather than confident decisions.
How does Quadratic enhance data analysis for business intelligence?
Quadratic streamlines data analysis for business intelligence by providing a unified workspace that combines spreadsheets with native Python and SQL. This allows for transparent logic, live data connections, and real-time multiplayer collaboration.
Why is transparency crucial for business analytics, data analysis, and decision-making?
Transparency is vital because it builds trust by making the logic behind data transformations visible and auditable to all stakeholders. When teams can see how numbers are derived, conversations shift from questioning accuracy to understanding insights, leading to more confident business analytics, data analysis, and decision-making.