
Modern finance is often defined by fragmentation. To get a clear picture of your net worth or cash flow, you likely have to log into a credit card portal, a separate student loan interface, and various bank feeds. Money is scattered, and the mental load required for the consolidation of financial information is significant, highlighting the need for robust best practices for financial data consolidation.
The natural reaction for most analysts and business owners is to build an accounting spreadsheet. However, this approach usually hits a wall. As your financial life grows more complex, the manual data entry becomes unmanageable, and fragile formula chains break the moment a merchant changes their billing descriptor (like "UBER *TRIP" suddenly becoming "Uber Technologies").
To truly master transaction tracking, you need a system that is more robust than a standard grid but more flexible than rigid accounting software. You need a "Unified Ledger"—a single source of truth built in a code-enabled environment like Quadratic. By leveraging Python and SQL directly within the spreadsheet, you can achieve spreadsheet automation for ingestion, cleaning, and categorization, transforming a messy manual chore into a resilient data pipeline.
The "unified ledger": why centralization matters
Before diving into the technical workflow, it is important to understand the accounting theory that makes this approach effective. Many spreadsheet users separate their data into tabs based on the source—one tab for checking, one for savings, and another serving as a credit card transaction tracker. While this keeps data tidy initially, it makes analysis difficult.
The "Unified Ledger" concept consolidates every inflow, outflow, transfer, and payment into one continuous dataset. The benefit of this centralization is real-time visibility. When you track bank transactions alongside liabilities and credit usage in a single view, you get an immediate, accurate picture of your net position.
Most SaaS finance tools force you into their predefined structures, and standard spreadsheets allow you to build your own structure but often fail to keep it stable. A code-enabled spreadsheet bridges this gap, allowing you to design a custom financial schema that is resilient enough to handle thousands of rows of data without crashing.
Step 1: Ingesting and normalizing data
The first step in building a Unified Ledger is bringing the data together. In a traditional workflow, you might download CSV exports from three different banks, open them, and manually copy-paste columns to match a master template. This is slow and error-prone.
In Quadratic, you can streamline this by importing the raw CSV files into separate sheets exactly as they are exported from the bank. Once the raw data is in the environment, you can use SQL to normalize it.
Instead of dragging cells around, you write a simple SQL query to select and rename specific columns from the raw data tabs and merge them into your Master Ledger. For example, one bank might call the column "Date" while another calls it "Posting Date." With SQL, you can map both to a standardized "Transaction_Date" column in your main view. This differs significantly from a standard Excel transaction tracker, where you must manually align columns every time you import new data.
Step 2: Automating categorization with Python
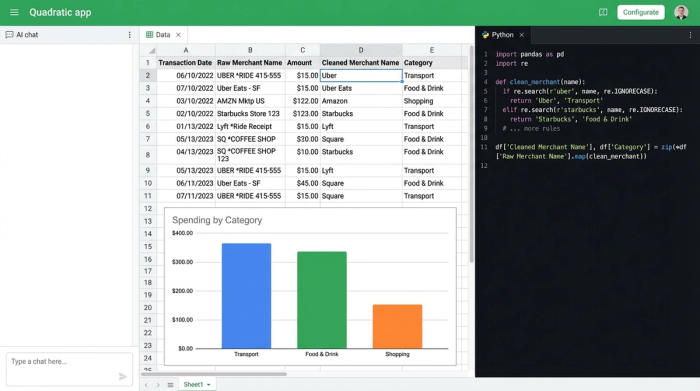
The most frustrating part of maintaining a financial spreadsheet is dealing with messy merchant names. A transaction might appear as "AMZN MKTP US*123" one day and "Amazon.com" the next. In a traditional spreadsheet, handling this requires endless nested IF statements or complex VLOOKUP tables that require constant maintenance.
This is where the "code-enabled" nature of Quadratic transforms the workflow. You can use Python directly in the spreadsheet to automate categorization based on pattern recognition, which is key for effective category spend analysis.
Using Python’s string manipulation capabilities or Regular Expressions (Regex), you can write a script that standardizes merchant names automatically. You can tell the script to look for any variation of "Uber"—whether it is "Uber Eats," "Uber Trip," or "Help.Uber"—and map it to a standardized "Uber" merchant name and a "Transport" category. Once this script is written, it runs automatically on new data rows. This solves the "manual categorization" pain point, ensuring your ledger is always clean without you having to review every single line item.
Step 3: Ensuring data integrity and anomaly detection
Accuracy is the difference between a rough estimate and a reliable financial tool. A common issue when you track bank transactions manually is duplication, underscoring the importance of robust data integrity checks.
In a code-enabled workflow, you can use Python’s Pandas library to instantly flag or remove duplicate transaction IDs. This ensures that your ledger never double-counts an expense.
For those looking to go deeper, having Python in the grid allows for advanced audit techniques. You can implement statistical checks, such as Z-score outlier detection, to flag transactions that deviate significantly from the norm. If your average coffee shop spend is $5, but a $500 charge appears in that category, the system can highlight it as an anomaly for you to review. This brings high-end audit capabilities to your personal or business finances.
Step 4: Querying your finances
Once the data is ingested, cleaned, and categorized, the final step is analysis. In standard spreadsheets, this usually involves creating pivot tables or using auto-filters that hide rows, making it difficult to see the big picture and the details simultaneously.
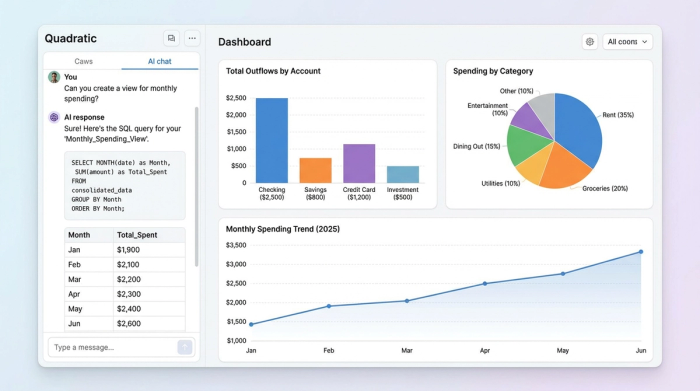
In Quadratic, you can query your finances using SQL to create dynamic "Views." You can write queries to answer specific questions without altering the underlying ledger data.
For example, you could write a query to "Show me all 'Dining' expenses greater than $100 from last month" or "Show total outflows grouped by Account." These queries result in live dashboards that update instantly as new data is added. This allows you to investigate exactly where money moved and why, turning your spreadsheet into an interactive financial application.
Why this beats the standard Excel transaction tracker
Mastering this workflow offers distinct advantages over traditional methods. First is scalability; Python handles thousands of rows of data significantly faster than VLOOKUP or INDEX/MATCH functions, which often slow down as the dataset grows. Second is flexibility; you are not locked into the rigid categories of a budgeting app, nor are you restricted by the fragility of standard spreadsheet formulas. Finally, there is auditability. Because the cleaning and categorization are done via code, you can always see exactly how the data was processed, giving you full trust in the numbers.
Conclusion
Effective transaction tracking does not have to be a choice between the manual data entry hell of a basic spreadsheet or the rigid, expensive limitations of pre-packaged software. By bringing code into the spreadsheet environment, you can build a Unified Ledger that learns your spending patterns and scales with your financial complexity.
You can stop relying on fragile formulas and start treating your finances with the rigor they deserve. By leveraging Quadratic, you can build a system that automates the tedious parts of financial tracking, leaving you with clear, actionable data.
Use Quadratic to Master Transaction Tracking
- Consolidate disparate financial data into a single, unified ledger using SQL for streamlined ingestion and consistent data mapping from all your bank feeds, credit cards, and loans.
- Automate categorization with Python to standardize messy merchant names and assign categories automatically, eliminating manual categorization and fragile
IFstatements. - Ensure data integrity and detect anomalies by using Python (Pandas) to automatically identify and remove duplicate transactions, and implement advanced checks like Z-score outlier detection for suspicious activity.
- Query your finances dynamically with SQL to create live, interactive views and dashboards, answering specific questions about spending patterns and cash flow without altering your raw data.
- Build a scalable, flexible workflow that handles thousands of transaction rows faster and more reliably than traditional spreadsheets, providing both robust auditability and custom control.
Ready to take control of your financial data? Try Quadratic.