
For modern finance leads, the consolidation of financial information is rarely a neat, linear process. It is a monthly battle against fragmentation. You are no longer dealing with a single general ledger; you are likely juggling CSV exports from Stripe for billing, Gusto for payroll, and multiple bank accounts that do not communicate with one another.
Defining the consolidation of financial information strictly as a compliance requirement misses the bigger picture. For growing companies, it is the only way to establish a genuine source of truth. Without it, you are left with isolated pockets of data that tell conflicting stories. The problem is that achieving this source of truth usually forces finance teams to choose between two flawed options when using traditional financial reconciliation tools: manual copy-pasting in spreadsheets, which invites human error, or implementing expensive Enterprise Performance Management (EPM) software, which often acts as a rigid "black box."
There is a third path. By utilizing a connected spreadsheet like Quadratic, you can ingest raw data, standardize it using transparent logic, and produce a unified report with perfect traceability. This approach allows you to build your logic once and automate the consolidation process for every future month end reconciliation.
Why traditional methods fail at scale
The pain of monthly reporting is usually synonymous with "version control hell." When you rely on traditional spreadsheet methods, you are often spending 90% of your time cleaning data and only 10% analyzing it.
The "manual villain" in this scenario is the copy-paste function. Every time you manually move data from a CSV export into your master consolidation sheet, you risk a misalignment that can ruin the integrity of the entire report. A single broken formula or a row shift can render hours of work useless, forcing you to trace your steps back to the source.
Conversely, many teams turn to SaaS solutions that promise automation. While these tools offer structure, they often lack the flexibility required for the messy reality of business data. If a bank changes its export format or a new billing tool introduces a non-standard column, these "black box" importers often fail. Finance teams need the flexibility to handle messy, evolving data without sacrificing the rigor required for formal accounting.
Moving from theory to practice
In academic settings, you learn strict rules—often referenced in coursework like chapter 2 consolidation of financial information—where entities align perfectly, and intercompany transactions are clear. However, the real world is significantly messier.
While the principles taught in chapter 2 consolidation of financial information provide the necessary theoretical framework for equity and control, they do not teach you how to handle a CSV file where the date column is formatted differently across three different subsidiaries. To bridge the gap between theory and practice, you need a workflow that enforces strict accounting principles on data that arrives in unstructured, unpredictable shapes.
The 4-step workflow for transparent financial consolidation
The most effective way to manage this process is to stop treating the spreadsheet as a static grid and start treating it as a data pipeline. In Quadratic, you can build a workflow that automates the ingestion and cleaning process, ensuring that your financial data standardization is consistent every month.
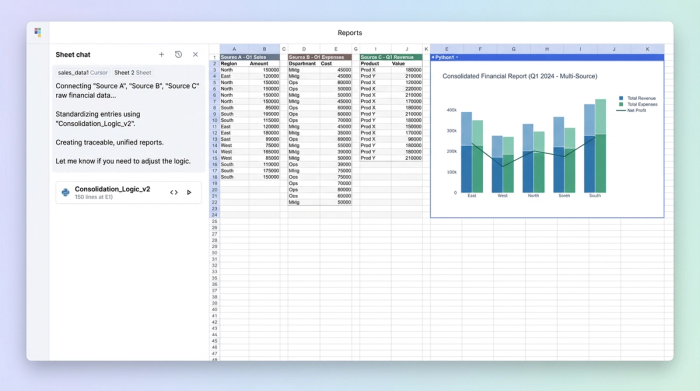
1. Centralize and ingest disparate data sources
The first step in a connected workflow is to stop opening five different Excel files to copy data manually. Instead, you can pull raw CSV exports—whether from banking for automated bank reconciliation, payroll, or billing platforms—directly into a single Quadratic workspace.
Because Quadratic supports Python and SQL natively within the grid, you do not need to pre-format these sources before bringing them in. You can ingest the "messy" raw data exactly as it comes out of your systems. This preserves the integrity of the source data, ensuring that you always have an unmodified record of what was exported.
2. Standardize column structures (normalization)
Data inconsistency is the enemy of speed. Bank A might label a column "Date," while Bank B labels it "Trans_Date." In a traditional workflow, you would manually rename these headers every month.
In a code-enabled spreadsheet, you can use SQL or Python to map these disparate columns into a single, standardized schema. You write a query once that tells the system, "When you see 'Trans_Date', treat it as 'Date'." This creates a clean, normalized dataset for analysis without ever altering the original source files. This level of financial data standardization is critical for ensuring that subsequent formulas and reports run without errors.
3. Map categories to a unified chart of accounts
Once the data is normalized, it must be categorized. This is where you turn vendor names like "Gusto_Run_123" and "ADP_Global" into a single line item called "Payroll Expense."
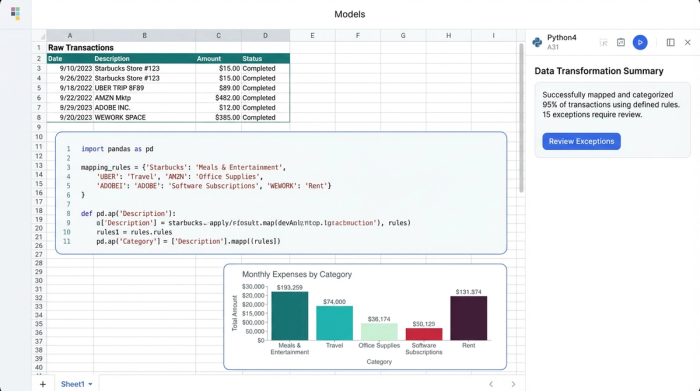
Unlike some tools that use opaque AI to guess categories for you, a connected spreadsheet allows you to define this logic explicitly. You build a mapping table that serves as the logic layer for your consolidation. This is also where you can script logic for automated intercompany eliminations, ensuring that transactions between entities are removed from the consolidated view systematically. Because the logic is written in code or clear formulas, it is transparent and applies automatically to all future data imports.
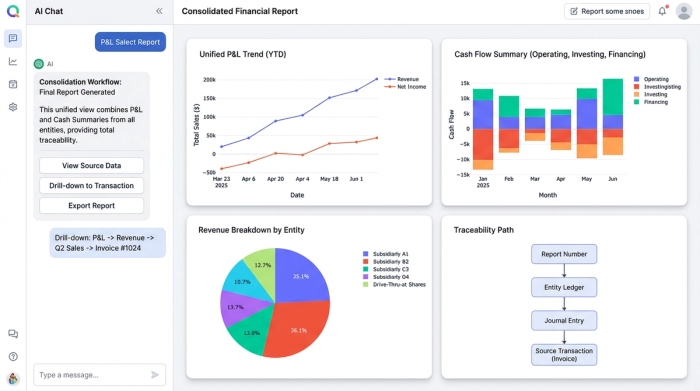
4. Generate the consolidated P&L with drill-down
The final output is your unified financial reporting view—a consolidated P&L and Cash Summary. However, the value here is not just in the final numbers, but in the confidence behind them.
Because the data is connected from source to summary, you achieve the "holy grail" of finance: total traceability. If a number on the P&L looks off, you can drill down from the final report directly to the specific transaction in the raw banking export. This eliminates the "black box" anxiety and allows you to defend your numbers with absolute certainty.
Transparency vs. automation: why you need both
The market often frames the choice as one between automation (SaaS) and flexibility (Excel). SaaS tools offer automation but hide the logic, making it difficult to verify how numbers are derived. Traditional spreadsheets offer flexibility but are fragile and prone to breakage.
A code-enabled spreadsheet like Quadratic provides auditable spreadsheet automation. You get the speed of automated data flows, but you can also see, read, and verify the Python code or SQL queries driving the consolidation. This transparency is essential for audits and gives Finance Leads the control they need to trust the system fully.
Conclusion
Effective consolidation of financial information isn't about working harder or becoming faster at data entry; it is about building a better data pipeline. By moving away from fragile manual links and rigid software, you can build a system where your exports flow into a standardized report automatically.
Stop relying on black-box software or risking your reputation on copy-paste errors. Experience the power of a connected spreadsheet. Start building your consolidated financial workflow in Quadratic today.
Use Quadratic to consolidate financial information
- Centralize disparate financial data from all your sources—like Stripe, Gusto, and multiple bank accounts—into a single, connected workspace.
- Automate data standardization and normalization using Python or SQL to consistently clean and structure messy raw imports.
- Map transaction categories to your unified chart of accounts and script automated intercompany eliminations with transparent, auditable logic.
- Produce accurate, consolidated financial reports with full drill-down traceability from summary figures to individual source transactions.
- Build your consolidation logic once to automate monthly close processes, eliminating manual copy-pasting and version control issues.
Ready to simplify your financial consolidation? Try Quadratic.