Table of contents
- The problem with traditional reconciliation workflows
- Step 1: Standardizing your inputs (the data cleaning reality)
- Step 2: Automating logic and variance checks
- Step 3: Building the leadership dashboard
- Key features to look for in modern tools
- Why the "builder" approach wins
- Conclusion
- Use Quadratic for financial reconciliation
For many financial controllers and accounting managers, the average month-end close cycle time makes the month-end close a recurring nightmare. It usually involves staring at disparate CSV exports, hunting for a five-cent variance across dozens of spreadsheet tabs, and worrying about whether the file version you are working on is actually the most recent one. The pressure to close the books faster conflicts directly with the need for absolute accuracy.
When professionals search for financial reconciliation tools, such as those for automated bank reconciliation, they are generally looking for any system or software that ensures accuracy and consistency in financial records between two or more independent sources. However, the market often presents a false dichotomy: you can either stick with manual spreadsheets, which are flexible but prone to human error, or purchase expensive, rigid enterprise software suites that take months to implement, highlighting common limitations of ERP systems.
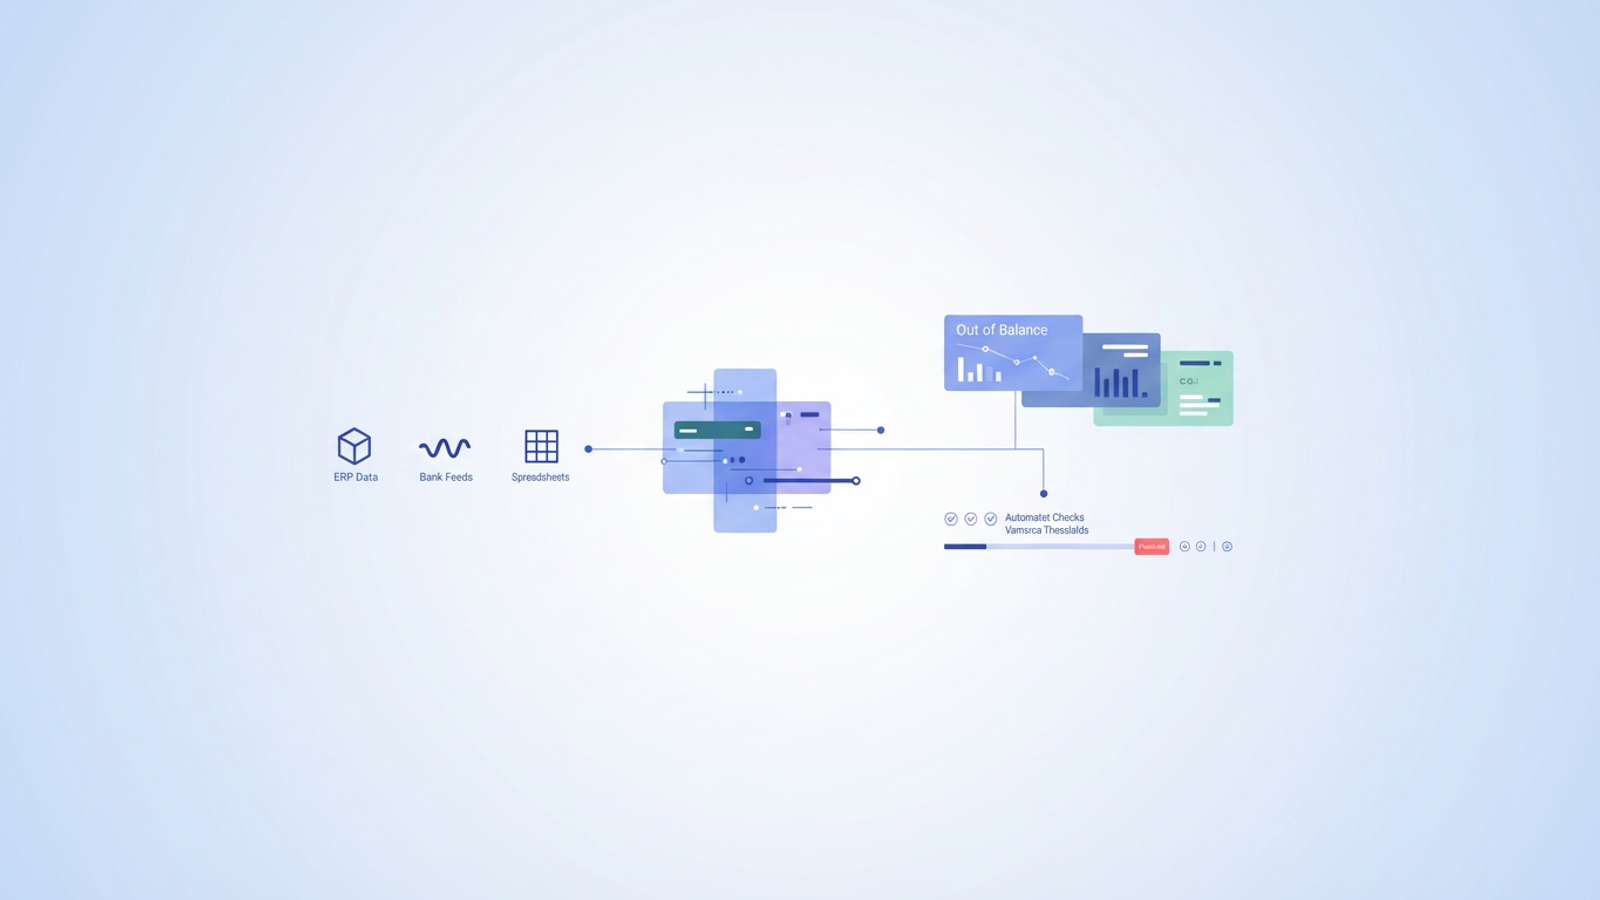
There is, however, a third path. Instead of buying a "black box" solution or suffering through manual drudgery, modern finance leaders are turning to programmable data workspaces, reflecting trends in how AI is reshaping accounting jobs. By using tools like Quadratic, controllers can build their own automated pipelines—combining the flexibility of a spreadsheet with the power of Python and SQL—to create a reconciliation process that is fast, repeatable, and transparent.
The problem with traditional reconciliation workflows
The reason the month-end close remains painful for so many organizations is that the standard tools often fail to address the reality of messy data.
On one end of the spectrum is the "manual trap" of traditional spreadsheets. While familiar, they rely heavily on copy-pasting data and fragile formulas. A single broken link or a fat-finger error can cascade through a workbook, wasting hours of investigation time. Furthermore, static spreadsheets lack detailed audit trails; if a number changes, it is often impossible to know who changed it or why.
On the other end is the "black box" trap of enterprise SaaS solutions. While these platforms offer structure, they are often rigid. If your company acquires a new entity or changes a bank provider, adapting the software to handle the new data format often requires expensive consultants or submitting a ticket to IT.
The modern controller needs a middle ground: a tool that offers the interface of a spreadsheet but the data integrity and automation capabilities of a database.
Step 1: Standardizing your inputs (the data cleaning reality)
Most software demos assume your data is perfect. In the real world, data is messy. You are likely dealing with raw exports from an ERP (like NetSuite or Sage), transaction logs from payment processors (like Stripe), and bank feeds that all use different date formats and column headers.
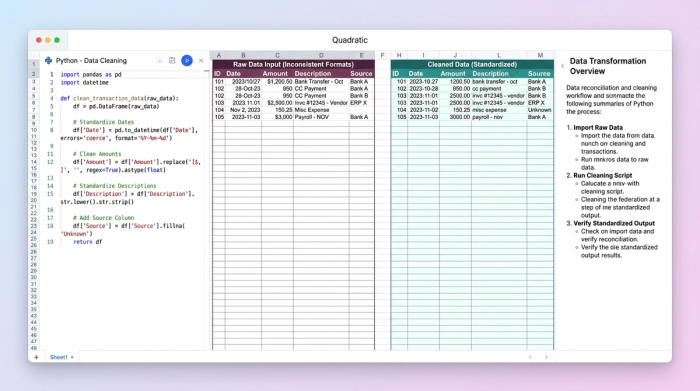
In a traditional workflow, the controller must manually open each CSV, delete header rows, reformat dates, and copy the clean data into a master workbook every single month. This is where errors happen.
In Quadratic, the workflow changes from "doing" to "building." A user recently successfully transformed their process by utilizing Python directly within the spreadsheet grid. Instead of manually formatting the data, they wrote a short Python script to ingest the raw CSVs. The script automatically standardized column names, formatted dates, and aligned the data structures, aligning with key financial data standardization best practices.
Because this logic is saved in the code, the process is repeatable. Next month, when the new bank feed arrives, the controller simply drops the file in, and the script runs instantly. The data cleaning happens automatically, ensuring that the reconciliation starts with standardized, error-free inputs every time, a key aspect of automated data processing.
Step 2: Automating logic and variance checks
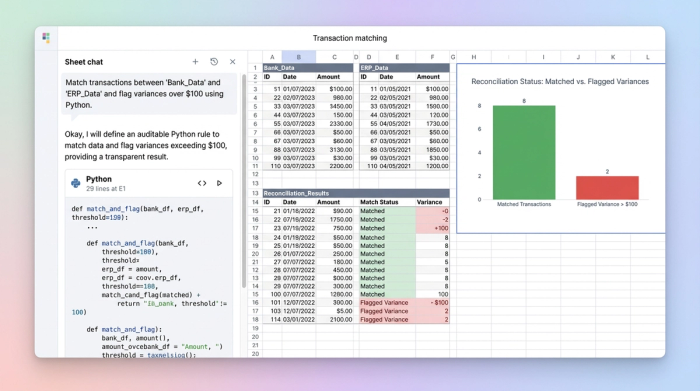
Once the data is ingested, the actual matching begins. In Excel, this usually means an endless series of VLOOKUPs or INDEX-MATCH formulas that bog down the file size and speed.
A better approach leverages financial reconciliation tool AI-powered matching logic built directly into the sheet. By using SQL or Python, you can define clear rules for how transactions should match. For example, you can join your ERP data with your bank data based on transaction IDs or reference numbers.
More importantly, you can programmatically handle variances. A common frustration is the "penny difference"—where a transaction is technically unmatched because of a $0.01 rounding error. In Quadratic, the user built a reusable template that defined specific variance thresholds. The logic was set to automatically "match" and ignore variances under $0.05, while immediately flagging any variance over $100 for human review.
This "white box" approach offers a distinct advantage over some AI tools. While "smart" algorithms can be helpful, finance teams need to explain exactly why a match occurred during an audit. Because the logic is written in clear code within the spreadsheet, you have full transparency into the matching criteria. You build the logic once, and the tool executes it instantly.
Step 3: Building the leadership dashboard
The final step of the close process is communicating the results. CFOs and leadership teams do not need to see the thousands of rows of matched transactions; they need to know if the books are balanced and where the risks lie.
In the user's workflow, the reconciled data didn't just sit in a tab; it fed directly into a summary dashboard. By using SQL queries on the reconciled dataset, the controller created a dynamic "Out of Balance" list that surfaced only the accounts requiring attention at the top of the sheet.
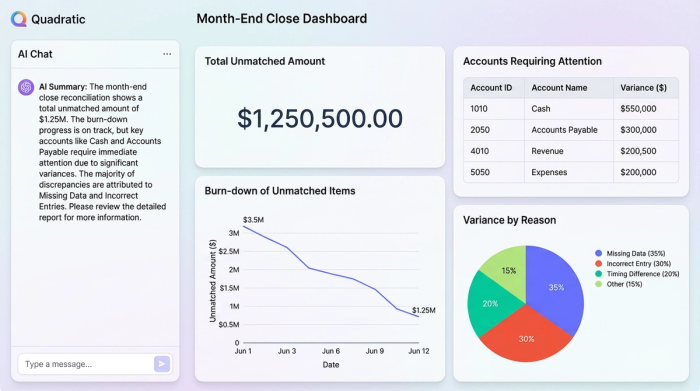
This dashboard served as a live status report. Instead of exporting data to PowerPoint to create charts, the user utilized Quadratic’s built-in visualization tools to graph the burn-down rate of unmatched transactions. This allowed leadership to review the status of the month-end close in real-time, providing visibility without requiring the controller to stop working to generate a report.
Key features to look for in modern tools
If you are evaluating software to modernize your finance stack, look for features that empower you to build, rather than just consume.
- Flexible data connections: Your tool should be able to handle various formats, from SQL databases and APIs to simple CSV uploads, without breaking.
- Intelligent automation: Look for AI tools for financial reconciliation and expense reporting that reduce manual ticking and tying. The goal is to automate the routine matches so humans can focus on the complex exceptions.
- Audit trails and change logs: Compliance is non-negotiable. Code-based workflows provide a natural history of what data was transformed and how, serving as a self-documenting audit trail.
Why the "builder" approach wins
The success of this workflow lies in the shift from manual execution to automated design. By using a tool like Quadratic, the controller achieved three critical outcomes:
1. Repeatability: The template is built once. The logic for cleaning and matching doesn't need to be reinvented every month; it just needs to be run.
2. Transparency: There are no hidden formulas or black-box algorithms. Every match and every variance flag is the result of clear, auditable logic.
3. Cost-efficiency: The team achieved enterprise-grade automation without the six-figure price tag or the year-long implementation time of a massive ERP module.
Conclusion
Financial reconciliation doesn't have to be a choice between manual drudgery and expensive, rigid software. By adopting a programmable data workspace, you can build a system that fits your specific data reality. Stop formatting CSVs every month—script it once, automate your close, and get back to strategic analysis.
Try Quadratic, the AI spreadsheet that does your work for you
Use Quadratic for financial reconciliation
- Automate messy data ingestion: Script once with Python to clean, standardize, and integrate disparate CSVs, ERP exports, and bank feeds automatically, eliminating manual reformatting each month.
- Build auditable reconciliation logic: Use Python and SQL directly in the grid to define precise matching rules and programmatically handle variances, ensuring transparency and accuracy for auditors.
- Accelerate month-end close: Replace fragile VLOOKUPs with robust code-based logic that runs instantly, significantly reducing the time spent on manual ticking and tying.
- Create real-time financial dashboards: Generate dynamic "out of balance" reports and visualizations directly from reconciled data, providing leadership with immediate status updates without manual reporting.
- Maintain full audit trails: Benefit from code-based workflows that inherently track data transformations, offering a clear, self-documenting history of all changes.
Ready to streamline your financial close? Try Quadratic.