Every bull market eventually faces a reality check. As economic expansion slows and the "easy money" phase fades, investment professionals face a distinct challenge. You need to pivot from aggressive growth chasing to a strategy that prioritizes capital preservation without sacrificing returns entirely. This is the essence of a sound late-cycle US economy investment strategy.
The problem for most analysts and portfolio managers is not a lack of theory. You know that defensive sectors and quality factors tend to outperform during this phase. The difficulty lies in execution. Most search results and investment circulars provide static lists of "top picks" or theoretical definitions of quality. They rarely offer a workflow for filtering the entire US stock universe in real-time based on strict, customizable risk metrics.
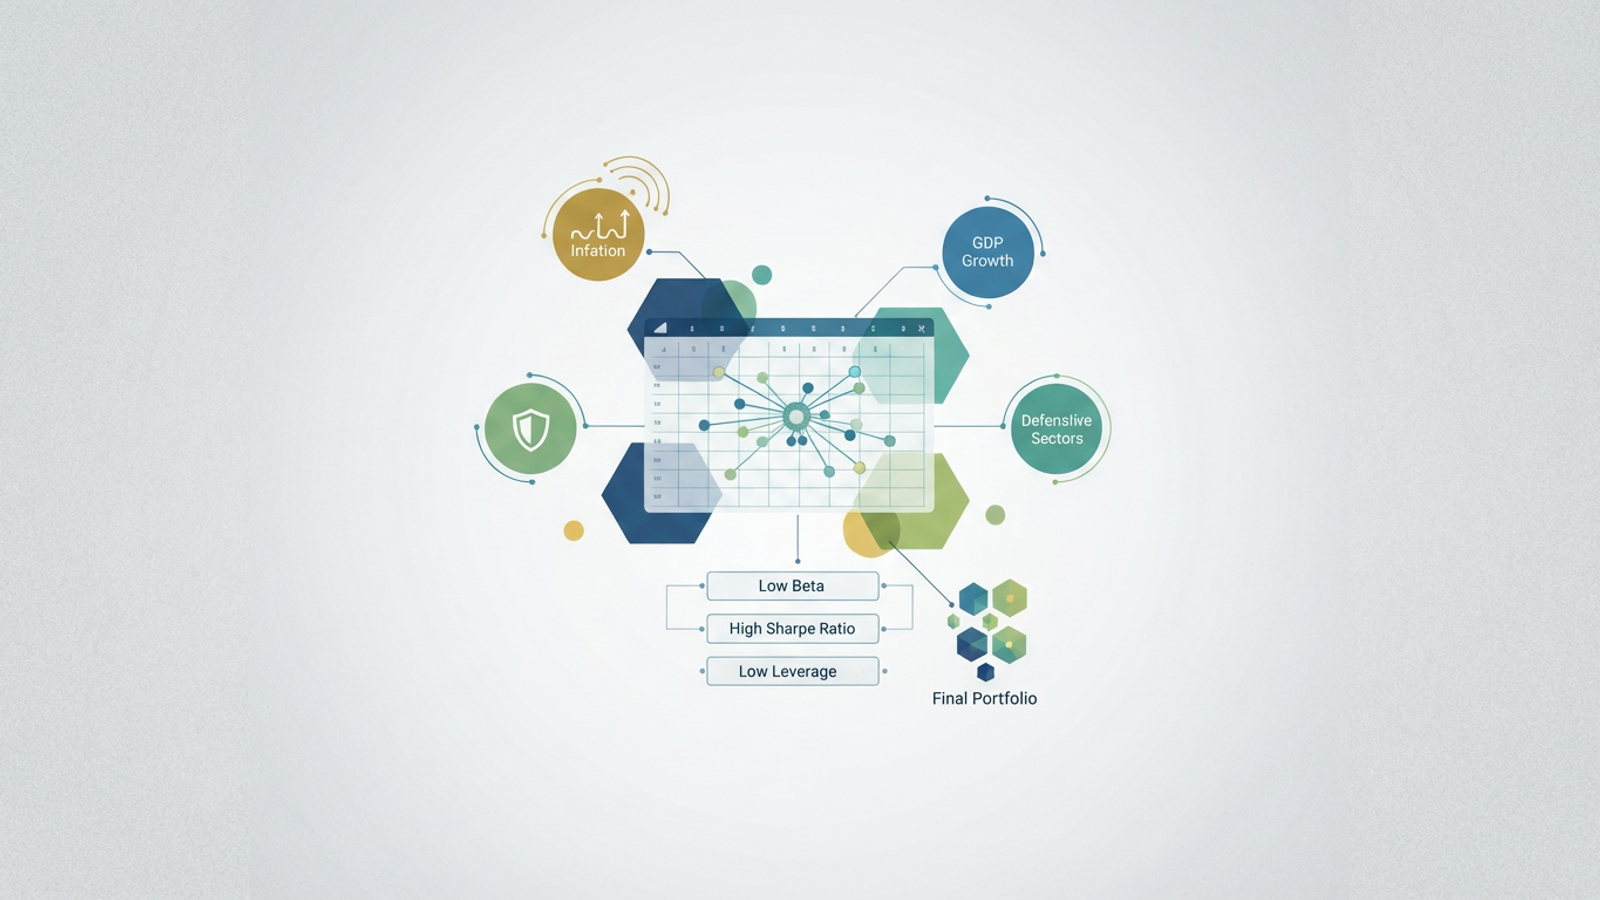
This is where we move from reading about strategy to building a live engine for it. By using Quadratic, we can combine live data fetching, Python-based quantitative filtering, and familiar spreadsheet logic in a single interface. We are not just looking for "good" companies; we are conducting thorough asset research to build a dynamic model that pulls economic data to confirm the cycle, then mathematically filters thousands of equities to isolate the most resilient assets for a defensive portfolio allocation.
Step 1: Confirming the cycle with live macro data
Before you begin rotating sectors, you must validate your macro thesis through robust macroeconomic analysis. Acting on a late-cycle assumption when the economy is actually in a mid-cycle re-acceleration can lead to significant underperformance. To avoid this, you need to rely on data rather than headlines.
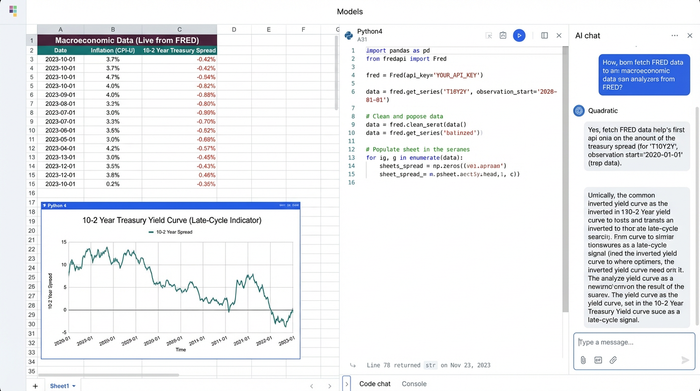
In a traditional workflow, an analyst might check a Bloomberg terminal or visit the St. Louis Fed (FRED) website, download a CSV, and paste it into a spreadsheet. In Quadratic, we streamline this by pulling live macro indicators, which are key economic growth indicators, directly into the grid using Python.
You can set up a script to fetch real-time inflation data, unemployment rates, and Treasury yield curves. By visualizing the yield curve spread directly next to your portfolio data, you can confirm the classic signals of a late expansion, such as an inverted yield curve or slowing GDP growth combined with sticky inflation. This live connection ensures your economic cycle forecast is always based on the most current numbers available. A sound strategy starts with this data integration, ensuring that your move to defensive assets is timed correctly.
Step 2: The defensive rotation (sector allocation)
Once the data confirms the economy is in a late-cycle phase, the standard playbook dictates a shift away from cyclical sectors like Consumer Discretionary or Technology, which often suffer when consumer spending tightens. The goal is to rotate capital into defensive havens that offer stable demand regardless of economic conditions.
Using Quadratic, you can ingest a dataset of the US stock universe and apply filters to isolate specific industries, performing comprehensive stock market analysis. For a defensive rotation, you will typically target sectors such as Consumer Staples, Healthcare, and Utilities. These sectors are often termed "recession-proof stocks" because demand for electricity, medicine, and basic food items remains consistent even during downturns.
However, simple sector selection is rarely enough. Within Quadratic, you can refine this further by filtering for industries benefiting from specific policy tailwinds. For example, you might filter the Utilities sector specifically for companies receiving infrastructure spending grants. This allows you to create a granular list of candidates that aligns perfectly with your defensive thesis, rather than buying a broad, cap-weighted sector ETF that might include lower-quality constituents.
Step 3: Screening for the "Quality" factor
Picking the right sector is only the first layer of defense. To truly insulate a portfolio against volatility, you need to apply the "Quality" factor. This involves identifying companies with robust balance sheets and consistent earnings power. While many platforms define these terms loosely, Quadratic allows you to calculate and filter them with mathematical rigor, performing in-depth financial analysis using Python libraries like Pandas directly in the sheet.
Low beta for market resilience
Beta is a measure of a stock's volatility in relation to the overall market. A beta of 1.0 indicates the stock moves in lockstep with the market. In a late-cycle strategy, where downside protection is paramount, you want to minimize exposure to market swings.
You can write a simple Python function in Quadratic to calculate the rolling beta for every stock in your filtered list over the last 12 to 24 months, a key component of financial time series analysis. By applying a filter to keep only low beta stocks (typically those with a beta significantly below 1.0), you effectively remove the most volatile names from your potential portfolio. This ensures that even if the broader market experiences a drawdown, your selected assets are statistically likely to experience less severe declines.
High Sharpe ratio for risk-adjusted returns
Investors often chase raw returns, but in a volatile environment, you must focus on efficiency. The Sharpe ratio helps you understand the return of an investment compared to its risk. You do not just want growth; you want high risk-adjusted returns.
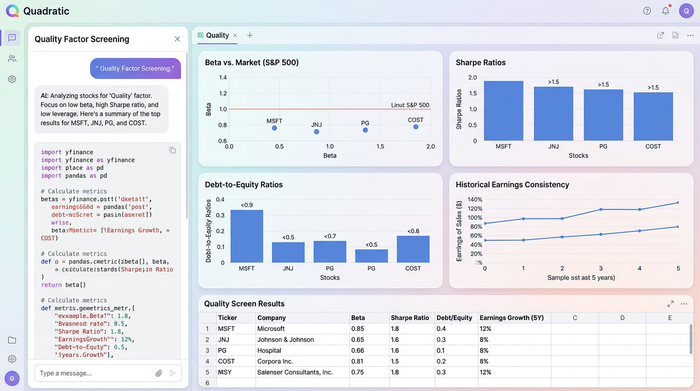
Performing a Sharpe ratio calculation on a list of hundreds of stocks can be cumbersome in traditional spreadsheets. in Quadratic, you can automate this. You calculate the excess return of each stock (return minus the risk-free rate) and divide it by the standard deviation of its returns. You can then rank your defensive list by this metric. This process highlights the companies that are not just safe, but are also delivering the most "bang for your buck" per unit of risk taken, a concept often explored through Monte Carlo simulation for more robust financial risk analysis.
Low leverage for balance sheet health
Late-cycle economies are often characterized by rising or elevated interest rates, which increase the cost of borrowing. Companies with heavy debt loads face significant headwinds in this environment as their interest, tax, depreciation, and amortization coverage shrinks.
To adhere to the principles of quality factor investing, you must assess balance sheet health through detailed financial analysis. You can pull financial statements and calculate the Debt-to-Equity ratio for every company in your list. By filtering for "Low Leverage," you eliminate companies that might struggle to service their debt if rates remain higher for longer. This step protects the portfolio from credit risk, ensuring that your defensive stocks are financially robust enough to survive a potential recession.
Step 4: Analyzing risks and finalizing the portfolio
After applying filters for sector, beta, Sharpe ratio, and leverage, you are left with a curated list of high-conviction assets, informed by thorough asset research. However, quantitative data cannot capture every nuance. The final step is to synthesize this data into a coherent portfolio management strategy.
At this stage, you can leverage Quadratic’s AI integration, which can enhance your predictive modeling and analytics capabilities. You can pass your final list of tickers and their associated metrics to the AI and ask for a summary of potential risks. For instance, the AI can analyze the list to identify common threats, such as high sensitivity to geopolitical events or supply chain disruptions specific to the healthcare industry.
This output transforms a raw list of stocks into a comprehensive report. You get a diversified stock portfolio, potentially including negatively correlated stocks for enhanced resilience, backed by hard math, accompanied by a qualitative risk analysis that highlights potential blind spots. This combination of quantitative filtering and AI-assisted reasoning provides the confidence needed to present the strategy to stakeholders or clients.
A dynamic playbook for volatile times
Navigating a slowing economy requires more than intuition. It demands a rigorous, data-driven approach. By moving your workflow into Quadratic, you replace static assumptions with a dynamic late-cycle US economy investment strategy. You are no longer just guessing which sectors might perform well; you are confirming the macro environment with live data, filtering for resilience with Python for in-depth stock market analysis, and validating quality with custom metrics.
Modern portfolio management requires tools that are as adaptable as the markets themselves. Instead of relying on rigid "best of" lists, investment professionals should empower themselves to build their own screeners that combine the flexibility of a spreadsheet with the power of code. This is the only way to truly find resilient growth when the easy money has already been made.
Try Quadratic, the AI spreadsheet that does your work for you
Use Quadratic to build a late-cycle US economy investment strategy
- Confirm macro thesis with live data: Pull real-time inflation, unemployment, and yield curve data directly into your sheet using Python to validate late-cycle economic signals, avoiding manual downloads and outdated information.
- Dynamically filter for defensive sectors: Ingest the US stock universe and apply granular filters to identify resilient sectors like Consumer Staples, Healthcare, and Utilities, further refining by specific policy tailwinds.
- Rigorously screen for quality factors: Automate calculations for low beta, high Sharpe ratio, and low leverage using Python in your spreadsheet, ensuring your portfolio comprises financially robust and risk-adjusted assets.
- Integrate AI for qualitative risk analysis: Pass your curated list of high-conviction assets to AI for a summary of potential risks like geopolitical events or supply chain disruptions, enhancing quantitative insights with qualitative intelligence.
- Build a dynamic, adaptable portfolio: Move beyond static lists to create a live investment engine that continuously updates based on real-time data and custom quantitative metrics, allowing for agile adjustments in volatile markets.
Ready to build your own dynamic investment strategy? Try Quadratic.