
Large-scale event coordination is a high-wire act. Deadlines are immovable, budgets are scrutinized to the penny, and a single missed dependency can cascade into a logistical failure. In this environment, a static spreadsheet acts less like a safety net and more like a liability. When a project manager has to manually update hundreds of rows to understand the current state of a portfolio, the data is often obsolete the moment it is saved.
The effectiveness of a program management office relies heavily on the quality and speed of its tools. While the methodology matters, the ability to visualize readiness and risk in real time is what separates a reactive team from a strategic one.
This article explores the definition of a modern PMO and details a real-world workflow: building a fully automated, live dashboard in Quadratic. By moving from fragile manual sheets to a code-enabled environment, teams can eliminate manual status reporting and focus entirely on delivery.
What is a program management office (PMO)?
To understand why the tooling needs to change, we must first define program management office in the context of modern business. A program management office is a group or department within an enterprise that defines and maintains standards for project management within the organization. Its primary goal is to ensure that projects and programs are executed in a repeatable, standardized way that aligns with business goals.
The traditional program management office definition centers on three core pillars: standardization, execution, and oversight.
- Standardization: The PMO sets the methodologies and best practices. It creates the "rulebook" for how projects are run.
- Execution: A program management officer is often responsible for ensuring resources are allocated correctly and that project managers are adhering to the defined standards.
- Oversight: Central to program management office responsibilities is the tracking of timelines, budgets, and risks across the entire portfolio.
However, the role of the PMO is evolving. Whether it is an IT program management office overseeing software rollouts or an an event PMO managing a global conference, the mandate has shifted. Governance is no longer enough. Today, the PMO is expected to provide real-time visibility and strategic foresight. This requirement for "live" intelligence is where traditional tools begin to crumble.
The challenge: why traditional spreadsheets fail the PMO
For decades, the spreadsheet has been the operating system of the PMO. It is flexible, familiar, and accessible. But for complex event tracking, standard Excel or Google Sheets workflows often become a bottleneck.
The first issue is fragility. As an event portfolio grows to include thousands of tasks, milestones, and resource allocations, the spreadsheet becomes heavy. Formulas break easily when rows are inserted, and the file often suffers from the "Excel Hero" problem—where only one specific person understands the complex web of macros and dependencies required to keep it running.
The second, and perhaps more costly issue, is the "narrative trap." In a traditional setup, the data does not speak for itself. A program management officer often spends Fridays manually reviewing rows of data, interpreting them, and writing a narrative status report to explain to stakeholders why a workstream is red or amber, highlighting some of the common pitfalls of project status reporting. This manual synthesis takes hours, introduces human bias, and delays the communication of critical risks.
To solve this, a modern PMO needs a hybrid approach: a tool that retains the flexibility of a spreadsheet grid but incorporates the data integrity and automation of an application. This is where Quadratic’s ability to mix standard formulas with Python and SQL becomes essential.
Building the automated PMO dashboard in Quadratic
In this specific use case, a project management professional utilized Quadratic to modernize a complex event monitoring system. The goal was to create a dashboard that required zero manual narrative reporting. Here is how the workflow was constructed.
1. Establishing data integrity with reference tables
The foundation of any reliable automation is clean data, underscoring the importance of data integrity for accurate reporting. In a standard spreadsheet, free-text entry is the enemy of accuracy. If one user types "Vendor A" and another types "Vendor-A," the reporting breaks.
In Quadratic, the user established extended reference tables for all core entities: tasks, milestones, resources, and stakeholders. By linking the main data entry grid to these reference tables, the system enforced strict data validation, utilizing different data validation techniques to ensure accuracy. This structure prevents "fat-finger" errors and ensures that the data fed into the dashboard is programmatic and consistent.
2. Automating logic and status flags
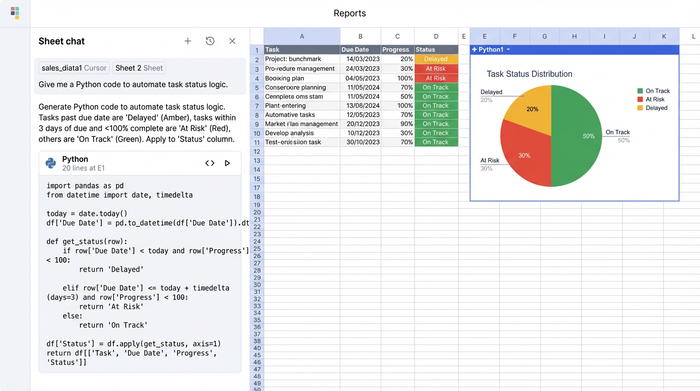
The most significant upgrade from a traditional sheet to this Quadratic dashboard is the automation of status logic. Instead of relying on a project manager to subjectively decide if a task is "at risk," the user implemented logic (using Python and formulas directly in the grid) to calculate status automatically.
The dashboard uses specific escalation logic to flag issues without human intervention:
- If a deadline is within 14 days and the task is not 100% complete, the system automatically flags it.
- If a task is marked "Critical Path" and is delayed by even one day, the status turns Red.
- If budget variance exceeds 10%, the cell auto-flags to Amber.
This removes the need for interpretation. The dashboard reports the mathematical truth of the project state. It frees the program management office responsibilities from the burden of debating what the status is, allowing them to focus on how to fix it.
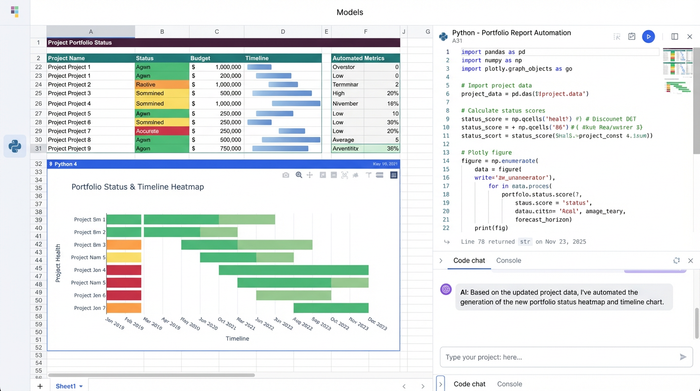
3. Visualizing readiness: Gantt charts and KPIs
With clean data and automated logic in place, the final step was visualization. The user integrated advanced Gantt chart features directly into the grid, allowing for a visual representation of timelines that updates instantly as dates change.
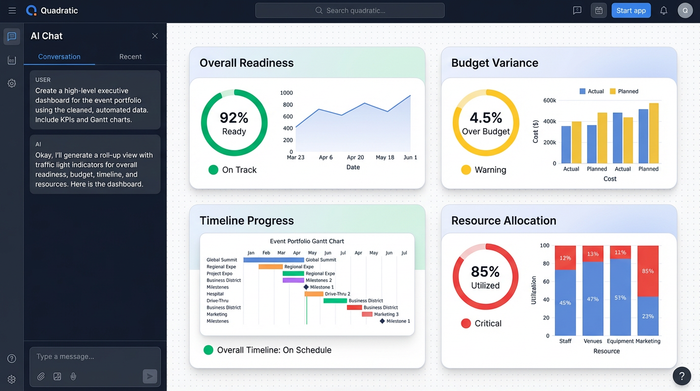
Crucially, the dashboard features a \"Roll-up\" view for Event Readiness. Individual workstream statuses aggregate upward to provide a high-level score. If a sub-stream in "Venue Logistics" turns Red, the top-level category reflects that risk immediately. A traffic light system (Red/Amber/Green) allows stakeholders to assess the health of the entire event portfolio at a glance. This visualization transforms rows of abstract data into a clear, actionable picture of readiness.
The result: actionable insights over manual reporting
The primary outcome of this transition was the elimination of the narrative status report. Because the dashboard logic is transparent and the data is validated, the dashboard is the report.
The program management office no longer needs to spend hours summarizing the week’s activities. They simply share the link to the live Quadratic canvas. Stakeholders can see exactly which milestones are at risk and why, without waiting for a weekly meeting.
Furthermore, the system allows for proactive issue detection, a key among the benefits of real-time project visibility. Because the alerts are triggered by logic rather than manual entry, risks are caught the moment the data supports them—not when a manager finally admits there is a problem. This shift allows the team to address budget overruns or timeline slippages while there is still time to correct course.
Conclusion: The Future of the Program Management Office
The role of the PMO is undergoing a fundamental shift. It is moving away from being an administrative gatekeeper and toward becoming a strategic enabler of business success. To make this transition, the tools must evolve alongside the responsibilities.
By adopting tools like Quadratic, which combine the ease of a spreadsheet with the power of code-based automation, a PMO can escape the cycle of manual reporting. Modernizing the program management office definition of success means valuing immediate insight over static documentation. For your next complex event or program, consider moving beyond the limitations of standard spreadsheets and building a dashboard that does the heavy lifting for you.
Use Quadratic to build a live program management office dashboard
- Eliminate manual status reports by automating project and program health flags directly in the grid.
- Ensure data integrity across tasks, milestones, and resources with enforced validation from reference tables.
- Automate critical path, deadline, and budget variance alerts using embedded Python and formulas for objective risk detection.
- Provide real-time visibility into event readiness with integrated Gantt charts and high-level roll-up KPIs.
- Empower proactive decision-making by surfacing risks and issues the moment data supports them, not after manual review.
Ready to transform your PMO's reporting? Try Quadratic.