
Table of contents
- Beyond the spreadsheet: why manual tracking fails
- Step 1: structuring data for integrity (the setup)
- Step 2: automating consolidation with Python (the logic)
- Step 3: building the interactive analytics dashboard
- Security and access: the "patient track login"
- Conclusion: better data leads to better care
- Use Quadratic for Modern Patient Tracking
Healthcare administration has evolved far beyond simple bed counts. Today, effective patient tracking is a multidimensional challenge that involves monitoring clinical outcomes, operational status, and longitudinal health data simultaneously. Whether you are an operations manager at a large hospital or a clinical analyst at a specialized care facility, performing data analysis in healthcare is crucial to maintain a "single source of truth."
Unfortunately, the tools used to manage this data often lag behind the complexity of the work. Many organizations still rely on disjointed spreadsheets to function as their primary patient tracking system, prompting the need for an effective excel alternative. Administrators frequently find themselves managing separate tabs for every month of the year, leading to a phenomenon known as "version control hell." When a stakeholder asks for a year-end report, the admin is forced to manually copy and paste rows, risking errors and broken formulas.
There is a better way. By adopting a dynamic patient tracker—one that leverages code-based logic within the spreadsheet—healthcare teams can automate data consolidation and ensure accuracy, leading to modern data analytics. This approach transforms a static grid into a central command center, capable of handling everything from surgery schedules to long-term care analysis without the fragility of traditional spreadsheets.
Beyond the spreadsheet: why manual tracking fails
Research into data management frequently cites a "fragility gap" in standard spreadsheet software, with one study finding that 94% of business spreadsheets have critical errors. This gap represents the distance between what a user needs the spreadsheet to do and what the software can reliably handle before breaking. For healthcare administrators, this gap is often where critical errors occur.
Traditional methods for merging data, such as Excel’s "Consolidate" feature or a Google Sheets alternative like IMPORTRANGE, are notoriously brittle. If a staff member adds a row to the "January" tab or changes a column header, the linked formulas in the master report often return errors or, worse, incorrect data. This fragility makes it nearly impossible to trust the output without manual verification.
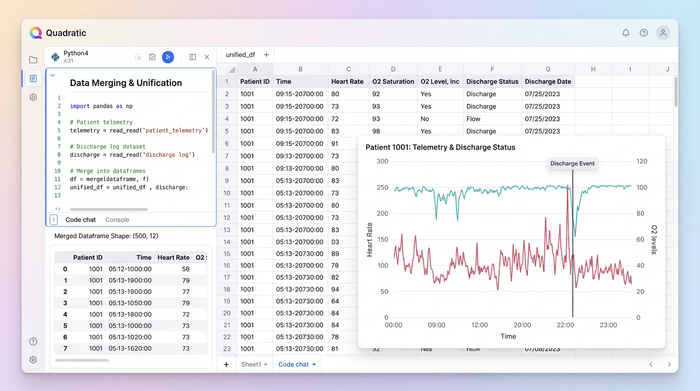
Furthermore, healthcare data is plagued by silos. A modern administrator must contend with inputs from vastly different sources. You might have telemetry data from a GPS tracker for dementia patients in one CSV file, while discharge logs—similar to what you might see in a peacehealth.org surgery patient tracking portal—live in a completely different system. In a standard spreadsheet environment, these files do not talk to each other. They remain isolated, requiring human intervention to merge them into a unified view.
To truly understand patient health and hospital operations, you need a system that can bridge these silos, leveraging AI in clinical data management. You need to merge logistics data, such as the location of a hospital bed using tracks for smooth patient transfer, with clinical data in a single, unified view. This requires a tool that moves beyond manual cell linking and embraces the power of relational data structures.
Step 1: structuring data for integrity (the setup)
The foundation of any robust patient tracking system is data integrity in healthcare. In the use case of a modern healthcare administrator, the first step involves setting up a rigorous environment for data entry. In standard spreadsheets, data validation is easily bypassed; a user can often paste text into a date field, corrupting downstream analysis.
In a tool like Quadratic, you can enforce strict data types. The workflow begins by establishing "Monthly Tabs," where each tab represents a specific month of patient intake or status updates. However, unlike a standard sheet where these tabs are loose collections of cells, here they are treated as structured data tables.
Whether you are building complex software for tracking patient brain function over time or a simple daily admission log, structure is key. By maintaining existing data validation rules—such as drop-down menus for diagnosis codes and strict date formats—you ensure that the data entering the system is clean. Conditional formatting plays a vital role here as well. Administrators can set rules to automatically flag high-risk patients, such as highlighting declining vitals in red, ensuring that critical changes in patient status are visually immediate to anyone entering data, aiding in proactive readmission analysis.
Step 2: automating consolidation with Python (the logic)
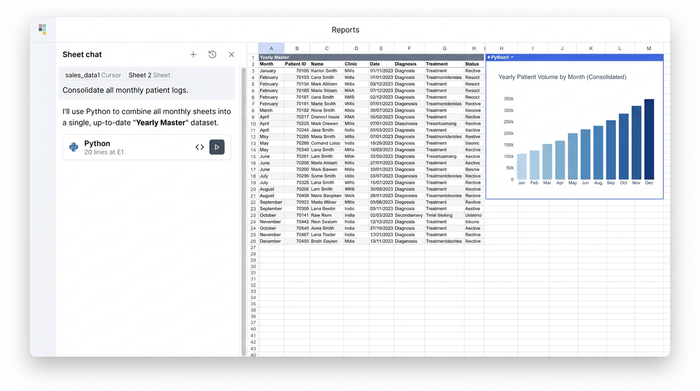
The most significant pain point for healthcare analysts is consolidation. In a traditional workflow, combining tabs from January through December into a "Yearly Master" requires complex macros or a fragile web of VLOOKUP formulas. If you need to correct a diagnosis in the "February" tab, you often have to remember to manually update the "Yearly Master" as well.
This is where the power of Python and SQL within Quadratic changes the game, making it one of the best data science tools available. Instead of manually linking cells, the administrator can write a short script to query all monthly tabs instantly. By using a simple SQL query—conceptually similar to SELECT * FROM sheets(Jan, Feb, Mar...)—the system automatically pulls data from every monthly tab into a single master view.
This creates a "Yearly Master" dataset that is dynamically linked to the source data. If a nurse corrects a typo in the "January" tab, the Master list updates instantly without the user needing to hit "Refresh" or re-run a macro. This approach introduces a layer of automated governance. It eliminates the human error inherent in the copy-paste process, ensuring that the aggregate report always reflects the most current data available in the daily logs.
Step 3: building the interactive analytics dashboard
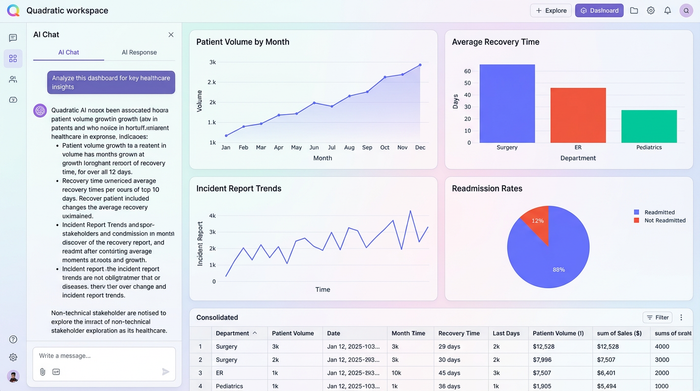
Once the data is structured and consolidated, the final step is visualization. A wall of text is rarely useful for quick decision-making; administrators need an interactive dashboard that translates rows and columns into insights, with research highlighting the Impact of Visualization Dashboards on Quality of Care.
In this workflow, the user leverages the consolidated data to build dynamic visualizations. Unlike standard pivot tables in legacy spreadsheets, which cache data and require manual refreshing, the pivot tables and charts in this modern workflow are live. They listen to the Python code that consolidates the data, ensuring that any new entry is immediately reflected in the visual analytics.
This allows for the creation of charts that track patient volume, recovery rates, or incident reports in real-time, enabling advanced predictive modeling and analytics. The dashboard becomes a self-service tool for non-technical stakeholders. A clinical director can filter the dashboard to isolate specific patient cohorts. For example, they could filter the visual tracker for dementia patients to monitor wandering incidents or check medication adherence rates for Q1, all without asking the data administrator to run a new report.
Security and access: the "patient track login"
When dealing with healthcare data, security is paramount. A common concern for administrators exploring new tools is how to control access to sensitive information. In a standard shared spreadsheet, access is often binary: you can either edit everything (and potentially break formulas) or view everything.
Modern data tools allow for much more granular permissions, addressing the intent behind searches for a secure patient track login. Security extends beyond the physical realm; just as a facility might use a non removable tracking bracelet for dementia patients to ensure physical safety, a robust software system uses strict authentication and role-based access control to secure data.
In Quadratic, the "Builder"—the person writing the Python code and SQL queries—can be separated from the "Viewer." This means a doctor or executive can log in to view the dashboard and filter data without having the permissions to alter the underlying code or raw data tables. This separation of concerns is critical for HIPAA alignment and general data governance, ensuring that the integrity of the tracking system remains intact regardless of how many people are viewing the insights.
Conclusion: better data leads to better care
The transition from fragile spreadsheets to a code-backed data environment offers a clear path forward for healthcare operations. The workflow is logical and repeatable: enforce strict validation at the point of entry, use Python to automate the consolidation of monthly records, and project that data into a dynamic, crash-proof dashboard.
Healthcare administrators should not have to spend their days fixing broken links or manually copy-pasting rows to build a year-end report. By adopting a tool like Quadratic, teams can stop fighting with their software and start focusing on what the data actually says. Whether you are tracking operational efficiency or clinical outcomes, the ability to trust your data is the first step toward delivering better patient care.
If you are ready to move beyond the limitations of traditional spreadsheets, explore how Quadratic can handle complex data consolidation and streamline your reporting workflows today.
Use Quadratic for Modern Patient Tracking
- Automate consolidation of monthly patient data into a single, dynamic master view using Python and SQL, eliminating manual copy-pasting and version control issues.
- Enforce strict data validation and use conditional formatting to ensure patient records are accurate from entry to analysis, flagging critical changes instantly.
- Bridge data silos by merging diverse healthcare data sources into a unified view, providing a comprehensive picture of patient health and operational status.
- Build interactive, real-time dashboards that instantly reflect new patient entries or status updates, enabling proactive decision-making without manual refreshes.
- Implement granular, role-based access controls to secure sensitive patient information, aligning with HIPAA compliance and data governance needs.
Ready to streamline your patient tracking and ensure data accuracy? Try Quadratic.