
For medical data analysts and quality improvement officers, the pressure to deliver accurate insights is immense. Hospital readmission analysis is not merely a statistical exercise; it is a critical component of patient safety monitoring, reimbursement strategy, and the continuous improvement of care quality, highlighting the importance of data analysis in healthcare. The stakes are high, yet the tools available for this work often force a frustrating compromise.
Analysts typically face a "transparency gap." On one side, traditional spreadsheets offer visibility and ease of use but crumble under the weight of longitudinal patient data, a common challenge in fields like survival analysis. On the other side, languages like Python and R offer the statistical power required for regression models and risk adjustment but often act as a "black box" to clinical stakeholders who cannot read code. This friction slows down the cycle of analysis and makes auditing difficult.
Quadratic resolves this tension by serving as a dedicated clinical workspace. By integrating Python directly into a familiar spreadsheet grid, it allows analysts to perform heavy statistical lifting—such as calculating frailty scores and tracking complications—while keeping the data visible, accessible, and audit-ready. This article outlines a real-world workflow, demonstrating how to move from messy, siloed surgical data to actionable clinical insights using a robust readmission analysis framework within Quadratic.
Ingesting complex patient data
Real-world clinical data is rarely clean or centralized. An analyst tasked with reviewing surgical outcomes usually has to contend with fragmented sources: a demographic table exported from the EMR, a surgical procedure log maintained by the department, and a separate registry for post-operative complications. In a traditional workflow, these disparate files lead to version control issues and cluttered folders.
In Quadratic, the workflow begins by ingesting these distinct datasets onto a single, infinite canvas. Analysts can pull in CSV exports or connect directly to databases via SQL within the sheet, leveraging the power of Python and SQL for robust data analysis. Because Quadratic is built to handle large datasets without the performance lag or row limits common in standard spreadsheets, the analyst can place the demographic data side-by-side with the surgical logs.
This spatial arrangement is crucial for clinical context. Instead of flipping between tabs or opening multiple files, the analyst has a holistic view of the raw data. This immediate visibility allows for quick visual spot-checks—verifying that the surgical dates align with the procedure codes—before any complex processing begins.
Cleaning and merging for longitudinal tracking
To perform accurate readmission analysis, isolated data points must be transformed into a longitudinal narrative that tracks a patient over time. The primary challenge here is merging datasets based on Patient IDs and encounter dates to determine if a patient returned to the hospital within 30, 60, or 90 days.
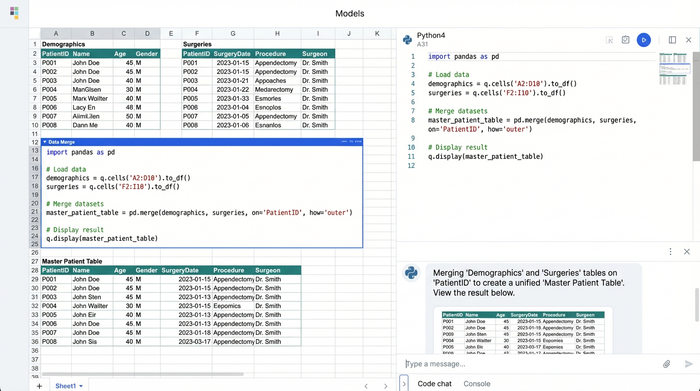
Attempting this in a standard spreadsheet often involves fragile VLOOKUP or INDEX/MATCH formulas that break when data formats change or when dealing with duplicate entries. In Quadratic, the analyst uses a Python cell to handle this complexity. Using the Pandas library, the analyst can write a few lines of code to merge the "Demographics" and "Surgery" datasets into a unified dataframe.
This code-based approach is far more resilient than spreadsheet formulas. It can programmatically handle null values, standardize date formats, and filter out irrelevant records instantly. The result is a clean, unified "Master Patient Table" generated directly in the grid. This table serves as the single source of truth for the subsequent analysis, ensuring that every readmission flag is tied to the correct index admission.
Calculating risk: frailty and complications
Raw readmission numbers can be misleading. A spike in the readmission rate might suggest a decline in quality of care, or it might simply reflect a sicker, more fragile patient population during that period. To make hospital readmission analysis meaningful, the data must be risk-adjusted.
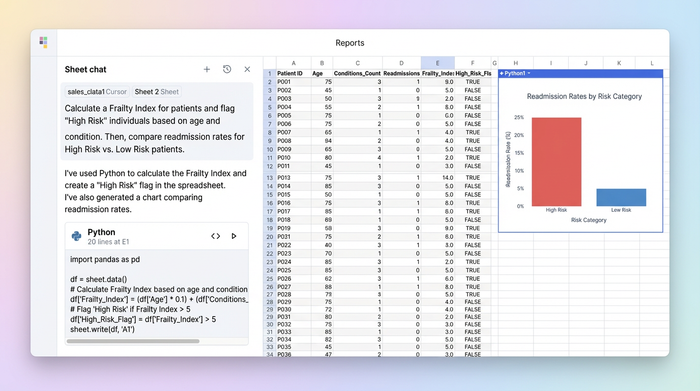
Quadratic allows analysts to calculate complex risk scores, such as a Frailty Index, directly within the workflow. Instead of exporting data to external statistical software, the analyst can use Python cells to run logic across the Master Patient Table. For example, a script can iterate through the patient list and apply clinical logic: if a patient is over 75 years old and has a comorbidity count greater than two, they are flagged as "High Risk."
The benefit of doing this in Quadratic is transparency. In a compiled script or a closed software ecosystem, this logic is hidden. Here, a Medical Director or Chief Quality Officer can click on the cell containing the Frailty Score and see the exact Python code used to define it. This transparency builds trust in the data, as clinical leadership can validate the methodology without needing to be data scientists themselves.
Visualizing temporal trends & outcomes
Once the data is cleaned and risk-adjusted, the focus shifts to identifying trends. Clinical teams need to know if interventions are working. Is the readmission rate for high-frailty patients improving year-over-year? Are specific surgical complications correlating with higher readmission numbers?
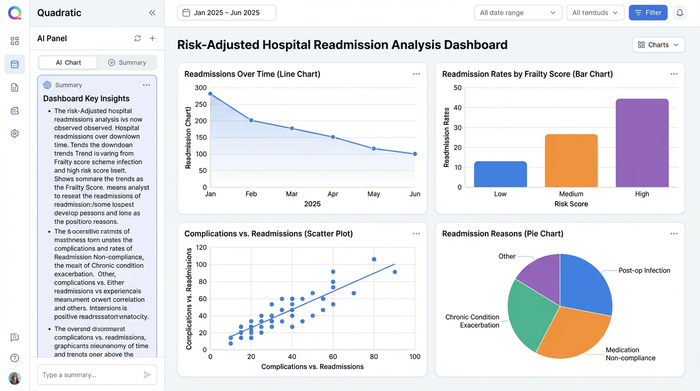
Quadratic enables the creation of professional-grade visualizations using libraries like Plotly or Matplotlib directly inside the sheet. An analyst can generate a trend line showing readmission rates over time or a scatter plot correlating complication rates with frailty scores.
Strategically, these visualizations live right next to the data tables. This proximity is powerful during Quality Improvement meetings. If a stakeholder asks a question that requires filtering the data—for example, excluding elective surgeries—the analyst can adjust the Python query, and the visualization updates instantly. This dynamic capability turns a static report into an interactive exploration of clinical outcomes.
From analysis to quality improvement (QI)
The ultimate goal of readmission analysis is to drive decision-making that improves patient care. The transition from data to insight requires not just accuracy, but reproducibility.
Because the entire workflow in Quadratic is code-based, it automatically creates a rigorous audit trail. If a regulatory body or an internal review board asks how the readmission metrics were derived, the analyst does not need to retrace steps through a maze of manual spreadsheet clicks. The code serves as definitive documentation of the methodology.
This rigorous approach leads to actionable insights. The final output is a dashboard that tells a clear story, perhaps revealing that high-frailty patients have a 20% higher readmission rate, suggesting the need for a targeted discharge protocol for that specific cohort. By providing a clear link between the raw data and the final conclusion, the analyst empowers the clinical team to implement changes with confidence.
A better workflow for clinical data
Healthcare analytics requires tools that are as rigorous and reliable as the medicine they support. The journey from raw surgical logs to risk-adjusted trend analysis is complex, but it does not have to be disjointed. Quadratic offers a clinical workspace that combines the flexibility to explore data visually with the power to prove results mathematically.
By closing the gap between the spreadsheet and the script, analysts can deliver hospital readmission analysis that is both sophisticated and transparent. For teams ready to elevate their analytical rigor, loading a de-identified dataset into Quadratic offers a first-hand look at how a unified environment can transform clinical data into life-saving insights.
Use Quadratic to do readmission analysis
- Perform complex risk adjustment: Calculate frailty scores and track complications using Python directly in the spreadsheet, making advanced statistical models transparent to clinical stakeholders.
- Unify fragmented patient data: Ingest demographic, surgical, and complication data from various sources onto a single, infinite canvas, eliminating version control issues and providing a holistic view.
- Track longitudinal patient outcomes: Robustly merge datasets with Python to identify 30, 60, or 90-day readmissions, creating a reliable "Master Patient Table" without fragile spreadsheet formulas.
- Visualize temporal trends dynamically: Generate professional-grade charts (Plotly, Matplotlib) next to your data, allowing instant updates and interactive exploration of readmission rates and risk factors.
- Ensure auditability and reproducibility: Leverage a code-based workflow that automatically creates a rigorous audit trail, providing definitive documentation of your methodology for internal reviews or regulatory bodies.
Ready to elevate your clinical data analysis? Try Quadratic.