
The medical research community is currently grappling with a "reproducibility crisis". As clinical trials become more complex and datasets grow larger, the traditional methods of managing data are showing their age. Clinical data is inherently messy, high-stakes, and often trapped in fragile spreadsheet formulas that are notoriously difficult to audit. For years, researchers have relied on manual data entry and basic formula-based calculations, which introduces a significant margin for human error.
This is where the integration of AI in clinical data management becomes essential for robust data analysis in healthcare. It represents a shift from passive data storage to active risk identification and predictive modeling. However, researchers often face a binary choice: stick with the ease of use found in standard spreadsheets like Excel, which lack statistical power, or switch to complex command-line tools like R or Python, which require a steep learning curve.
Quadratic offers a hybrid solution. It is a modern spreadsheet that runs Python and SQL natively within the grid. This allows clinical analysts and epidemiologists to implement rigorous AI and machine learning workflows without abandoning the familiar spreadsheet interface. By bridging the gap between ease of use and analytical power, researchers can ensure data integrity and statistical confidence in their studies.
The challenge: why standard spreadsheets fail clinical analysis
To understand the necessity of advanced tools, one must first acknowledge the limitations of the status quo. Standard spreadsheets have long been the default tool for clinical data analysis because they are accessible and visual. However, when applied to the rigorous demands of modern epidemiology or clinical trials, they often fail to provide the necessary reliability.
The primary risk lies in data integrity. In a traditional spreadsheet, the logic is often hidden behind cell references. A researcher might manually copy and paste patient data from one sheet to another, or drag a formula down a column. If a row is shifted or a filter is applied incorrectly, patient outcomes can become misaligned with treatment variables. These manual interventions create a "black box" where errors go unnoticed until peer review—or worse, after publication.
Furthermore, standard tools are mathematically limited. While they handle basic summations and averages effectively, they struggle with the complex statistical methods required for medical research, such as regression analysis, survival analysis, and p-value calculations. Trying to force a standard spreadsheet to perform these tasks often results in convoluted, fragile workbooks that are impossible to audit. Quadratic addresses this by enforcing structure and code-based logic, ensuring that the analysis is as robust as the data itself.
Integrating AI and ML in clinical data management
The concept of AI and ML in clinical data management is often misunderstood as simply using a chatbot to write summaries. In the context of rigorous research, it means applying powerful software libraries—such as pandas for data manipulation and scikit-learn for predictive modeling—to automate the analysis of patient outcomes.
This requires a fundamental workflow shift. In a traditional setting, an analyst might manually filter rows to exclude patients who dropped out of a study. In a Python-enabled environment like Quadratic, the analyst writes a script to clean, normalize, and prepare the data. This script serves as a permanent record of the logic used.
If the raw data changes—for example, if a new batch of patient records is uploaded from the hospital database—the cleaning process repeats automatically. This automation reduces the time spent on data wrangling and allows the researcher to focus on the actual science. It transforms the spreadsheet from a static ledger into a dynamic analytical engine.
Step 1: ingesting and cleaning patient data
The first step in any robust clinical study is bringing the data into a controllable environment. In Quadratic, the user does not need to rely on manual copy-pasting, which is a primary source of data corruption. Instead, they can connect directly to a SQL database or import a CSV file programmatically.
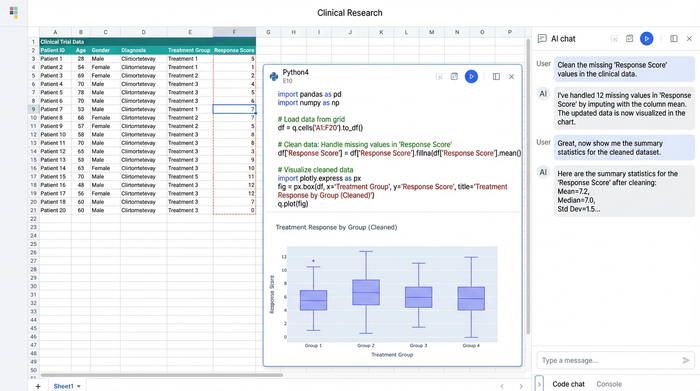
Imagine a scenario where a researcher is performing health data exploration, analyzing a dataset containing disease indicators, demographic information, and treatment details. In a standard tool, handling missing values—such as patients who missed a follow-up visit—is a manual process. The researcher might delete the row or manually input an average.
In Quadratic, the user opens the code editor directly within a cell. Using Python, they can handle these missing values programmatically. They might choose to impute missing data based on the mean of the cohort or flag the specific rows for exclusion based on strict criteria.
Because this is done via code, there is a clear audit trail. Anyone reviewing the study can look at the code cell and see exactly how the data was prepared. This transparency is vital for regulatory compliance, such as with a HIPAA-compliant spreadsheet and peer review, ensuring that the study's foundation is solid before any analysis begins.
Step 2: risk factor identification & predictive modeling
Once the data is clean, the workflow moves to the core of the research: understanding relationships between variables and outcomes. This is where predictive modeling in healthcare moves beyond the capabilities of standard spreadsheet formulas.
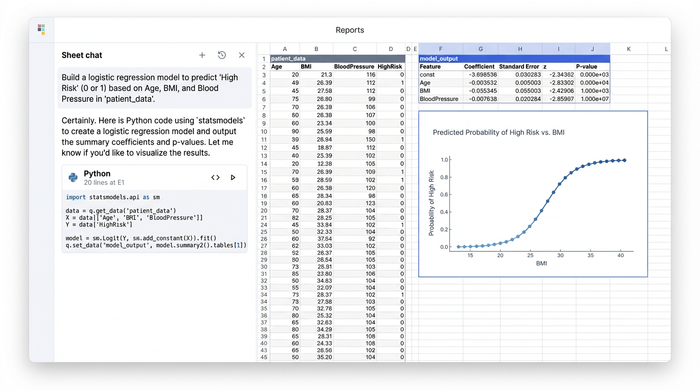
In a typical workflow, a researcher might want to identify which factors—age, BMI, specific biomarkers—are most strongly associated with a negative patient outcome. Standard spreadsheets cannot natively perform the logistic regression or Cox proportional hazards models required for this type of analysis.
In Quadratic, the user can import statistical libraries directly into the sheet. They can define their dependent and independent variables and run a logistic regression model in a matter of seconds. The output—including coefficients, p-values, and confidence intervals—renders directly in the spreadsheet grid.
This capability allows the researcher to calculate Relative Risk (RR) and Odds Ratios (OR) with statistical precision. More importantly, they can use the model to predict outcomes. By feeding new patient data into the trained model, the spreadsheet can output a probability score for specific risks. This turns the document from a retrospective report into a predictive tool that can aid in decision-making.
Step 3: visualizing outcomes for research
Visual communication is critical in clinical research, both for understanding the data and for publishing findings. Standard spreadsheets are limited to basic charts that often lack the granularity required for scientific papers.
Quadratic allows researchers to utilize Python data visualization libraries, such as matplotlib, seaborn, or altair, to generate high-quality visualizations directly in the sheet. For a clinical study, this might mean generating a Kaplan-Meier survival curve to visualize the time-to-event for different treatment groups.
Unlike a static image pasted into a report, these visualizations are dynamic. Because they are generated by code that references the data in the grid, they update automatically. If the underlying patient data is refined or expanded, the survival curve redraws itself instantly.
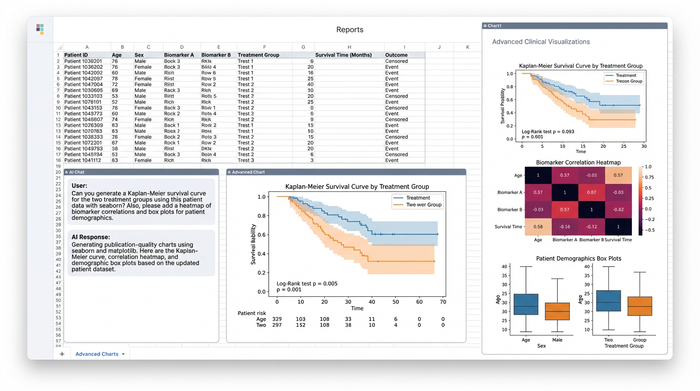
This applies to other complex visuals as well, such as heatmaps showing correlations between different disease indicators or box plots visualizing the distribution of biomarkers across different demographics. This level of visual density helps researchers spot patterns that might be missed in a simple table of numbers.
The future of clinical research is reproducible
The integration of AI in clinical data management is ultimately about confidence. In an era where scientific reproducibility is under scrutiny, the tools researchers use must provide transparency and rigor.
Quadratic offers a distinct advantage by combining the flexibility of a spreadsheet with the auditability of a code notebook. Every step of the analysis—from the initial data cleaning to the final p-value calculation—is visible in the code. There are no hidden formulas or "magic numbers" hardcoded into cells.
This approach democratizes access to advanced statistics. Researchers do not need to be full-stack software engineers to leverage the power of Python. They can perform complex statistical work within a familiar interface, without the friction of setting up a complex development environment. By adopting tools that prioritize reproducibility, the medical community can move away from fighting fragile formulas and focus on predicting outcomes and improving patient care.
Use Quadratic to do AI in clinical data management
- Bridge the gap between spreadsheets and advanced analytics: Seamlessly integrate Python and SQL for rigorous AI and machine learning workflows directly within a familiar spreadsheet environment.
- Automate data cleaning and ensure integrity: Programmatically ingest and clean complex patient datasets with Python, establishing clear, auditable logic for regulatory compliance and reproducibility.
- Conduct advanced statistical analysis and predictive modeling: Apply powerful statistical libraries for logistic regression, survival analysis, and risk factor identification, rendering precise outputs directly in the grid.
- Create dynamic, publication-ready visualizations: Generate high-quality charts like Kaplan-Meier curves and heatmaps using Python graphing libraries, ensuring visuals update automatically with data changes.
- Build reproducible clinical research workflows: Maintain complete transparency with code-based analysis, eliminating hidden formulas and fostering confidence in study results.
Ready to transform your clinical data workflows? Try Quadratic.