
Trading options without a log isn't trading; it is gambling. To survive standard market volatility, you need to track more than just your profit and loss; you need to adopt a disciplined, systematic trading approach that tracks your edge, your discipline, and the mechanics of every execution.
Many traders start with a static option trading journal pdf, but quickly realize these documents offer no analytical value. Others turn to basic spreadsheet tools, only to find that complex formulas break the moment they try to track multi-leg strategies like Iron Condors or Vertical Spreads.
The solution is a programmable coding spreadsheet for options trading. By using Quadratic, a tool that combines the familiarity of a spreadsheet with the power of Python, you can build a monthly execution log that automates your profit targets, calculates financial risk instantly, and visualizes your performance, leveraging a programmatic approach to improve workflow efficiency and reduce human error. This guide will walk you through building a best options trading journal that adapts to your workflow, not the other way around.
Why the best options trading journal is one you build
Discipline is the primary differentiator between profitable traders and those who blow up their accounts. A journal acts as an objective mirror, revealing emotional errors such as FOMO (fear of missing out) or revenge trading. While the psychological benefits are clear, the method of tracking matters just as much as the habit itself.
You can purchase expensive options trading journal software, but these platforms often force you into their specific workflow. If you trade a niche strategy or want to analyze your data in a specific way, you are often out of luck. Conversely, building your own tool gives you complete control over your data and how it is visualized for clear financial insights.
Using Quadratic, you can create a free options trading journal that functions like premium software but remains entirely yours. You own the data, you own the logic, and you can tweak the code as your trading strategy evolves.
Step 1: Setting up your execution log
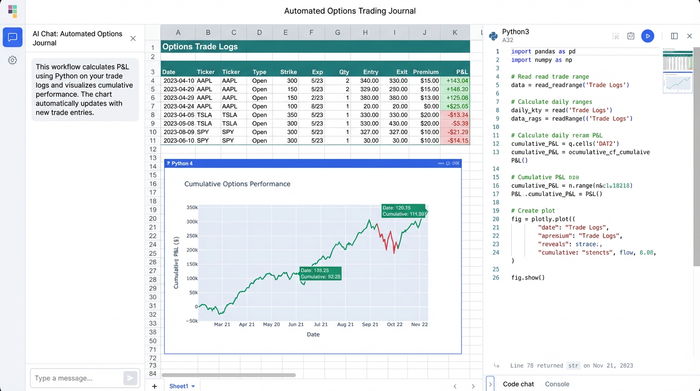
The foundation of any investment tracking spreadsheet journal is the execution log. This is where you input the raw data of your trades. In a standard spreadsheet, you might struggle with formatting dates or getting currency symbols to align correctly. In Quadratic, you can set up a clean, typed grid immediately.
To match the workflow of a serious options trader, set up your header row with the following columns:
- Date/Time: When the trade was executed.
- Ticker: The underlying symbol (e.g., SPY, TSLA).
- Strategy: The type of trade (e.g., Iron Condor, Vertical Spread, Naked Put).
- Strikes: The specific strike prices involved.
- Expiration: The date the contracts expire.
- Entry Price: The premium collected or paid per contract.
- Contracts: The number of contracts traded.
By defining these inputs clearly, you ensure that your data is structured for the automation we will add in the next step.
Step 2: Automating target price & profit calculations
This is where the programmable nature of Quadratic separates it from a standard spreadsheet. In traditional tools, calculating a profit target usually involves dragging a formula down a column. If you sort your data or delete a row, those references often break or shift, leading to calculation errors that can cost you money.
Instead of fragile cell formulas, you can use Python to automate the logic for the entire column.
Automating Target Price
For a strategy like an Iron Condor, you might have a strict rule to close the trade at 50% profit. You can write a simple Python script in the "Target Price" column that references your "Entry Price" and automatically outputs the exit price. If you sold a spread for $2.00, the cell automatically populates $1.00 as your target buy-back price.
Calculating Profit Amount
Options math requires accounting for the multiplier (usually 100 shares per contract). You can automate the "Profit Amount" column to calculate (Entry Price - Exit Price) 100 Contracts. By doing this in Python, the logic lives in the code, not the cell. This means you can filter your journal by "Winning Trades" or "Losing Trades" without breaking the calculation chain.
Total % Profit
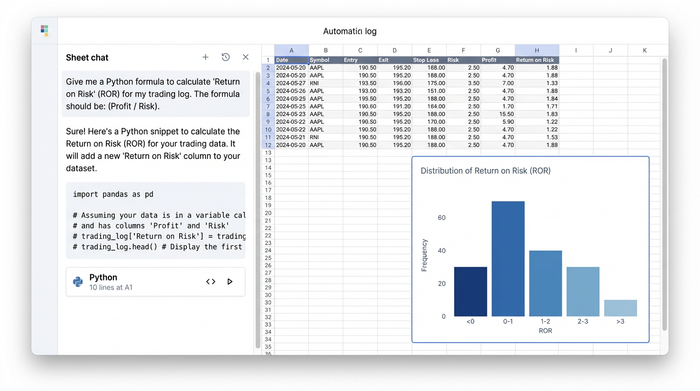
Finally, automate a "Return on Risk" column. This dynamic calculation helps you normalize performance across different capital allocations, ensuring you aren't just looking at raw dollar amounts but at the efficiency of your capital.
Creating the "summary row" for instant analysis
A list of trades is useful, but a dashboard is better. To make this an effective option trading journal template, you need a summary row or section that aggregates your performance in real-time.
In Quadratic, you can create a summary section at the bottom of your log or in a separate "Dashboard" sheet that pulls data directly from your execution log. Key metrics to track include:
- Total Risk: The sum of capital deployed or margin reserved across all open positions.
- Total Sold: The gross premium collected for the month.
- Total Profit/Loss: Your bottom-line performance.
- Average Profit %: A crucial metric for consistency. One lucky 200% trade shouldn't hide a streak of ten 5% losses.
By automating these summaries, you can see the health of your monthly strategy at a glance without manually adding up rows.
Visualizing your edge (beyond basic sheets)
A standard option trading journal pdf or a basic free options trading journal spreadsheet download usually stops at the numbers. However, advanced data visualization is often faster for the human brain to process.
You can use conditional formatting to instantly flag trades. Set rules to turn rows green for wins and red for losses. This allows you to spot streaks instantly. If you see a sea of red in the "Iron Condor" rows but green in "Vertical Spreads," you have an immediate visual cue to adjust your strategy.
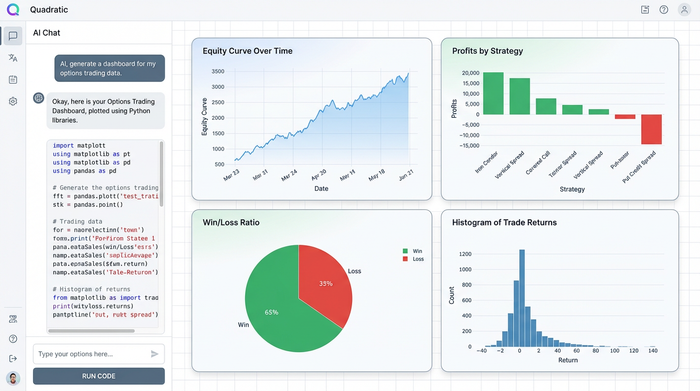
Because you are working in Quadratic, you can take this a step further. You can use Python libraries like Matplotlib or Plotly directly in the grid to plot your equity curve or a distribution of your returns. This level of data analytics allows you to see if your edge is increasing or decaying over time.
Download your options trading journal template
There is a high volume of traders looking for a quick fix, searching for a free options trading journal spreadsheet download. While downloading a pre-made finance template is a good starting point, the most effective tools are the ones you understand inside and out.
By building this journal in Quadratic, you create a best trading journal for options that is tailored to your specific needs. You aren't just filling in boxes; you are engineering a workflow that enforces your trading rules.
Start by creating a new sheet in Quadratic. Set up your columns, write the simple Python logic to handle the multipliers and profit targets, and create your summary row. This process transforms your journal from a passive record-keeping chore into an active part of your trading edge.
Conclusion
A professional trader treats their journal as their boss. It tells them when to stop, when to size up, and when a strategy is no longer working. By automating the complex math—target prices, multiplier calculations, and risk summaries—in Quadratic, you spend less time entering data and more time analyzing the market.
Don't settle for a static PDF or a fragile spreadsheet. Start building your automated options trading journal in Quadratic today and turn your data into a competitive advantage.
Use Quadratic to build your options trading journal
- Automate complex calculations for profit targets, options multipliers, and financial risk instantly using Python, ensuring your journal remains robust even with multi-leg strategies.
- Build a fully customizable options trading journal that adapts to your unique strategies and analysis needs, providing complete control over your data and logic.
- Access real-time performance insights with dynamic summary rows that track total risk, gross premium, profit/loss, and average profit percentage without manual aggregation.
- Visualize your trading edge with advanced charts and conditional formatting, allowing you to quickly spot streaks, trends, and areas for strategy adjustment.
- Maintain full ownership and control over your trading data and analytical models, enabling you to evolve your journal as your strategies change.
Start building your automated options trading journal today. Try Quadratic.