
Table of contents
Every day, product managers and data analysts are bombarded with a deluge of qualitative data, requiring effective qualitative data analysis techniques. Between support tickets, app store reviews, NPS surveys, and social media mentions, the voice of the customer is loud, but it is often unintelligible at scale, making effective customer feedback analysis crucial. It is humanly impossible to manually read every single comment while maintaining a coherent view of the broader trends. This is where sentiment analysis software usually enters the picture, promising to instantly categorize thousands of rows of text into neat piles of positive, negative, and neutral feedback.
However, anyone who has blindly trusted these tools knows the danger of doing so. A model might misinterpret a sarcastic "Great job breaking the login button" as positive praise, or flag a technical description of a bug as a negative emotional outburst. When you rely on these "black box" scores to drive product strategy or allocate support resources, accuracy matters more than speed.
To get real value from your data, you cannot simply run the software and accept the output. You must evaluate and calibrate it. By treating sentiment analysis as an audit process rather than a magic wand, you can build a workflow that validates accuracy and highlights nuance. This article outlines a practical method for auditing your tools using a transparent data workspace like Quadratic, allowing you to compare models, establish ground truth, and turn raw text into insights you can actually trust.
What is sentiment analysis software?
At its core, software for sentiment analysis, an example of AI tools for data analysis, utilizes Natural Language Processing (NLP) to interpret and classify text data based on emotional tone. These tools scan sentences for keywords, grammatical structures, and context clues to assign a polarity score—usually ranging from highly positive to highly negative.
While the underlying technology is similar across the board, the specific applications vary depending on who is using the data:
- Customer sentiment analysis software is primarily used by product and success teams to monitor feedback, reduce churn, and prioritize feature requests based on user frustration or delight.
- Employee sentiment analysis software helps human resources departments gauge internal culture and morale through anonymous surveys or internal communication channels.
- Social media sentiment analysis software is vital for marketing teams monitoring brand health, campaign reception, and potential PR crises in real-time.
While these tools are essential for scaling analysis, they are not all created equal. A generic model may perform well on one type of data but fail miserably on another. This variability is why the selection process is critical.
The challenge: Why "best" is subjective
If you search for the best sentiment analysis software, a common query among those seeking the best data science tools, you will find endless lists of vendors, but "best" is a dangerous fallacy in the world of NLP. A model trained primarily on Wikipedia articles or formal literature will struggle to understand the abbreviations, emojis, and slang found in Twitter data. Conversely, a model trained on social media might be completely baffled by the technical jargon found in a B2B enterprise support ticket.
The well-documented challenges of sentiment analysis, such as irony, sarcasm, and negation (e.g., "I don't hate it"), are notorious for tripping up standard algorithms. Furthermore, context is king. The word "sick" is negative in a healthcare context but potentially positive in a gaming or lifestyle context.
Because of this, you cannot rely on a vendor's accuracy claim. You need a sandbox environment—a place where you can bring your specific data and test different models against each other before deploying them. This is where a tool like Quadratic becomes invaluable. By combining the flexibility of a spreadsheet with the power of Python and SQL, you can create a testing ground to audit how different libraries interpret your unique customer language.
Workflow: How to audit and compare sentiment models
Evaluating sentiment analysis software requires a structured approach. Instead of hoping for the best, you can run a "bake-off" between models to see which one aligns most closely with reality. Here is a step-by-step workflow for auditing your sentiment analysis using a data grid.
1. Ingesting diverse data sources
The first step is centralization. You need to pull your raw qualitative data into a single environment where it can be manipulated and scored, often requiring data cleaning tools for preparation. In a standard spreadsheet, this might involve messy CSV imports or copy-pasting, but a modern data workspace allows for more robust connections.
In Quadratic, you can import data directly from APIs, databases, or SaaS platforms. For a comprehensive audit, you should ingest a variety of data types. For example, you might pull short, slang-heavy reviews from the App Store, formal survey responses from Typeform, and conversational transcripts from Zendesk.
It is critical to keep this unstructured text side-by-side with your structured data, such as dates, product versions, and customer tiers. Context variables are often the key to understanding why sentiment spikes or dips. By having all this data in one infinite grid, you prepare the stage for a direct comparison of how different models handle the same text.
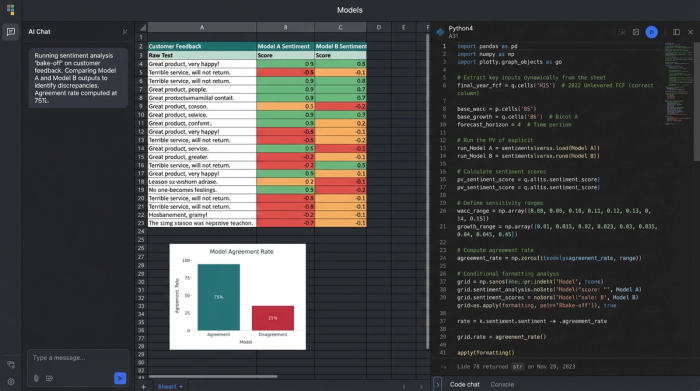
2. Running a model "bake-off" (agreement rates)
Once your data is in the grid, you can begin the evaluation. Rather than relying on a single sentiment provider, you can use the Python capabilities within Quadratic to run multiple models on the same column of text.
For instance, you might run a column using the VADER library (optimized for social media) and TextBlob or a commercial API like OpenAI. This creates a side-by-side comparison for every single row of customer feedback.
The most powerful metric you can generate here is the "Agreement Rate." You can write a simple formula to check if the models agree on the classification, similar to how one might evaluate business category classification methods. If Model A labels a comment as "Positive" and Model B labels it as "Negative," that row is flagged as a disagreement.
Using conditional formatting in the grid, you can visually highlight these rows. High disagreement rates often indicate that your data is nuanced or filled with jargon that standard models are failing to catch. This visual "bake-off" immediately shows you which model is more consistent and where the confusing data lies.
3. Establishing "ground truth"
Software needs calibration, and the only way to calibrate it is with human intuition. To truly validate accuracy, you need to establish a "Ground Truth" baseline for your model.
Select a random sample of your data—perhaps 100 to 200 rows—and manually read and label them yourself in a new column. This human score serves as the answer key. You can then compare the output of the sentiment analysis software against your manual labels to calculate a true accuracy percentage.
If a model claims 90% confidence but only matches your human labels 60% of the time, you know it is not ready for production. This "human-in-the-loop" workflow allows you to pick the tool that actually understands your customers, rather than the one with the best marketing.
Handling the "hard parts": The exceptions queue
Most articles on sentiment analysis list sarcasm and ambiguity as unsolvable problems. They suggest that you simply have to accept a margin of error. However, a robust data workflow allows you to manage these exceptions rather than ignore them.
In your Quadratic workspace, you can build an "Exceptions Queue." This is a filtered view of your data designed specifically to catch the rows where the software is likely to fail. You can filter for:
- Neutral scores: Models often dump confused data into the "Neutral" bucket. Reviewing these often uncovers hidden bugs or mild frustrations that aren't strong enough to trigger a negative score but are vital for product improvement.
- Low confidence scores: If the software returns a confidence interval, filter for the bottom 20%. These are the comments the model is unsure about.
- Known triggers: You can use SQL or Python to query for rows containing words like "actually," "however," or specific emojis that often denote sarcasm.
By isolating these specific rows, an analyst can manually review the 5% of data that matters most, rather than wasting time reading the 95% of straightforward praise or complaints. This hybrid approach—automation for the obvious, human review for the complex—is the most efficient way to handle large datasets.
Visualizing the output: From scores to decisions
Once your data has been scored, audited, and calibrated, the final step is to turn those rows and columns into decisions. A spreadsheet full of sentiment scores is not a report; you need to visualize the trends to communicate insights to stakeholders.
Because you are working in a tool that combines analysis and visualization, you can build dashboards directly on top of your data. You might track:
- Sentiment over time: Use trend lines to see if customer happiness is trending up or down over the last quarter.
- Sentiment by product area: Break down scores by feature or tag to see if a specific part of your app is driving negative reviews.
- Sentiment by release version: Overlay release dates on your sentiment chart to instantly see if a new update caused a drop in satisfaction.
- Sentiment by customer segment: Compare Enterprise vs. SMB sentiment to see if your highest-paying customers are facing different issues than your free users.
The distinct benefit of using Quadratic for this is the ability to drill down. In many business intelligence tools, the chart is disconnected from the raw data. Here, if you see a spike in negative sentiment for a specific product release, you can look directly at the adjacent cells to read the actual comments driving that score. This connection between the "what" (the score) and the "why" (the text) is what enables data-driven storytelling.
Conclusion
Sentiment analysis software is a powerful accelerator for any team drowning in customer feedback, enabling deeper feedback analysis, but it should never be treated as an autopilot solution. The nuance of human language requires a pilot—a data professional who can audit the tools, compare the models, and manage the exceptions.
By moving your analysis into a transparent data workspace, you gain the ability to look inside the black box. You can verify agreement rates, establish ground truth, and visualize the results without ever leaving the grid. This rigorous approach transforms sentiment analysis from a vague estimation into a reliable business metric.
If you are ready to stop guessing and start validating your customer insights, you can begin building your own sentiment evaluation workflow in Quadratic today, perhaps starting with a sentiment analysis template.
Use Quadratic to Evaluate Sentiment Analysis Software
- Centralize all qualitative data: Bring in app reviews, support tickets, and survey responses alongside structured data for a unified view.
- Compare multiple sentiment models: Run different NLP models (VADER, TextBlob, OpenAI) on your unique text data directly in the grid.
- Measure model agreement and accuracy: Calculate how consistently models classify sentiment and validate their performance against human-labeled ground truth.
- Isolate ambiguous feedback for human review: Filter for neutral scores, low confidence predictions, or sarcasm indicators to efficiently manage exceptions.
- Visualize trends and drill into raw comments: Create dynamic dashboards to track sentiment over time or by segment, then instantly access the underlying text for context.
Ready to build a more reliable sentiment analysis workflow? Try Quadratic.