
Growth is a "good problem" to have, but for direct-to-consumer (DTC) brands, scaling revenue often brings a less welcome companion: tax complexity. As your business crosses state lines, you inevitably trigger economic nexus laws, transforming a simple monthly filing into a logistical maze of paying sales tax in multiple states.
For many finance managers and founders, the pain isn't just the payment itself—it is the chaos of preparation. You likely find yourself logging into Shopify, Amazon Seller Central, and Stripe, downloading disparate CSV files, and attempting to reconcile conflicting data formats to determine what you actually owe. It is a fragile, manual process that eats up days of productivity every month.
The standard advice is often to buy expensive enterprise compliance software immediately. However, before you automate, you must organize. You don't necessarily need a five-figure software contract to solve the immediate pain of estimation and preparation. You need a better way to handle your data. By building a dynamic multi-state sales tax worksheet, you can turn a fragmented mess into a clear, audit-ready workflow.
The hidden complexity of multi-state compliance
Most resources on this topic focus heavily on the legal definitions. They explain that sales tax liability is triggered by "nexus," which can be established through physical presence (like a warehouse) or economic activity (reaching a certain revenue or transaction volume). While understanding these rules is essential, the practical hurdle that trips up most finance teams is data aggregation.
The sheer volume of transaction data required to calculate liability accurately is overwhelming. A growing ecommerce brand might generate thousands of lines of transaction data per month across multiple channels. To remain compliant, you must isolate sales by state, separate taxable goods from non-taxable ones, and apply the correct local rates.
The biggest challenge in paying sales tax in multiple states isn't writing the check—it's aggregating the data to know how much to write. When your data is trapped in silos, you lack the visibility to see when you are approaching a threshold or how much cash to set aside for quarterly filings. This data gap is where compliance errors happen.
Why standard spreadsheets fail at tax compliance
For years, the default tool for this job has been the standard spreadsheet. You export your data, open Excel or Google Sheets, and start copy-pasting. While this works for a single state or low transaction volumes, it quickly breaks down as you scale.
Standard spreadsheets struggle with the fragmentation inherent in ecommerce. You are forced to manually combine exports from Shopify (which might format dates one way) and Amazon (which formats them another). This manual handling is the primary source of human error. Furthermore, standard spreadsheets treat data as static text. If you find a discrepancy and need to update a source file, you often have to break your formulas or start the copy-paste process over from scratch.
This is where Quadratic changes the workflow. As an AI-powered spreadsheet that integrates native Python and SQL, Quadratic allows you to build a workspace that functions more like a database than a flat file. You can ingest large datasets without performance lag and write queries to clean and organize the data automatically, eliminating the fragility of traditional manual reporting.
How to build a multi-state sales tax worksheet
The most effective way to manage this process is to create a central "lake" for your transaction data. By using Quadratic, you can build a multi-state sales tax worksheet that updates dynamically, giving you a clear view of your liabilities without the manual drudgery. Here is how a finance professional can structure this workflow.
1. Consolidate data from all channels
The first step is to stop treating your sales channels as separate entities. In Quadratic, you can import raw CSV exports from Shopify, Amazon, Stripe, and PayPal directly into the grid. Because Quadratic handles large datasets efficiently, you don't need to worry about the row limits that often slow down browser-based spreadsheets.
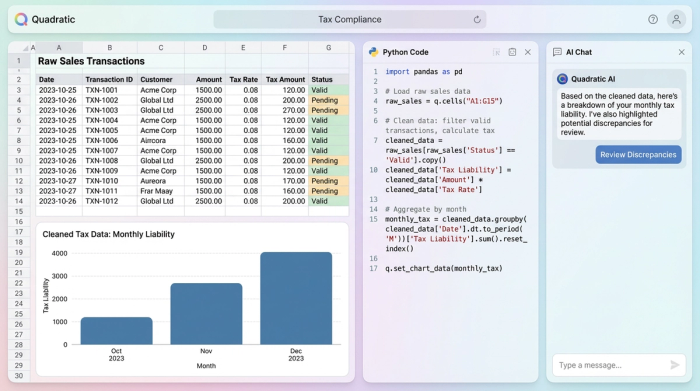
Once the data is in the sheet, you can use Python or SQL to unify the column names. For example, Shopify might use "Shipping Province" while Amazon uses "Ship State." With a simple SQL query, you can standardize these into a single "Destination State" column, creating one master list of all transactions for the period. This creates a single source of truth for consolidating sales data, ensuring nothing slips through the cracks.
2. Filter for nexus and exemptions
With your data consolidated, the next step is filtering. You don't pay tax on every sale, only those where you have nexus and where the product is taxable. Using SQL within Quadratic allows you to filter this data instantly without complex filter menus or fragile pivot tables.
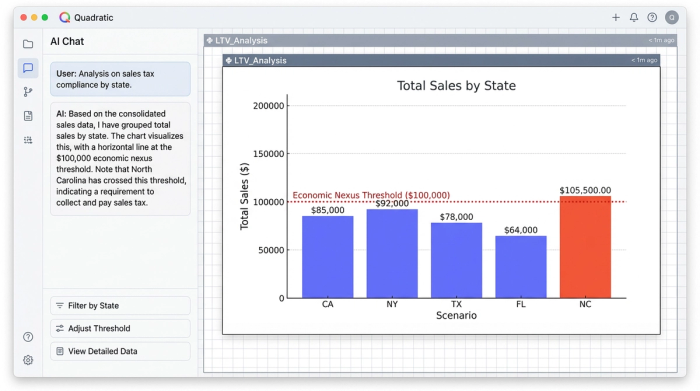
You can write a query to display only transactions where the destination state matches the states where you are registered. Furthermore, you can filter out wholesale orders or tax-exempt customers to arrive at a "True Taxable Sales" figure. This capability is critical for monitoring your status against a sales tax nexus threshold. By grouping your total sales by state, you can instantly see if your sales in a new state—say, North Carolina—have crossed the $100,000 economic nexus threshold, signaling that you need to register and start collecting.
3. Apply jurisdiction-specific rates
Once you have isolated your taxable sales, you need to apply the correct math. Instead of manually looking up rates for every calculation, you can import a reference table of state and local tax rates into your Quadratic sheet.
Using Python, you can join your sales data with your tax rate table. The logic is straightforward: Taxable Sales * Combined Rate = Estimated Liability. This method is far superior to manual entry because it allows you to handle the nuance of jurisdiction-specific rates. If a state has a base rate plus a local district rate, your data structure can account for that, providing a highly accurate estimate of what you will owe when you log into the state portal.
4. Track filing frequencies and due dates
The final piece of the puzzle is management. You likely have different filing frequencies for different states—some monthly, some quarterly, some annually. A "Dashboard" view at the top of your Quadratic sheet keeps this organized.
You can create a summary table that lists each state, your assigned filing frequency, the next due date, and the current estimated payment based on the live data below. This turns your spreadsheet into an active alert system. Rather than digging through file folders to remember if Pennsylvania is due this month, your dashboard tells you exactly where you stand.
From data chaos to audit-ready confidence
Successfully paying sales tax in multiple states requires organization, not just automation. While many businesses eventually graduate to fully automated remittance tools, those tools are often "black boxes." You feed data in, and they tell you what to pay.
By maintaining your own data workflow in Quadratic, you gain a layer of audit-ready confidence. You possess an independent record of how you arrived at your numbers, allowing you to prepare for a sales tax audit or audit your accountant's work. You move from reacting to tax deadlines with fear to approaching them with a verified plan.
Ecommerce sales tax compliance doesn't have to be a nightmare of broken formulas and late nights. By controlling your data first, you turn a complex obligation into a manageable, repeatable monthly process.
Disclaimer: This article describes a data management workflow and does not constitute legal or tax advice. Tax laws vary significantly by jurisdiction and change frequently. Always consult with a qualified tax professional or CPA regarding your specific business obligations.
Use Quadratic to Streamline Paying Sales Tax in Multiple States
- Consolidate transaction data from all sales channels (Shopify, Amazon, Stripe) into a single, unified view, eliminating manual reconciliation of disparate CSV files.
- Clean and standardize messy data formats across platforms using native Python and SQL, ensuring accuracy and reducing human error.
- Instantly filter and segment sales data by state to identify nexus obligations, separate taxable from non-taxable goods, and monitor economic nexus thresholds with powerful SQL queries.
- Apply jurisdiction-specific tax rates automatically by joining your sales data with a reference table, providing highly accurate liability estimates without manual lookups.
- Build a dynamic dashboard to track filing frequencies, due dates, and estimated payments for each state, turning your worksheet into an active alert system.
- Maintain an audit-ready, transparent record of how your sales tax numbers are calculated, giving you confidence beyond "black box" compliance tools.
Ready to simplify your multi-state sales tax preparation? Try Quadratic.