
Table of contents
Every tax season, accountants face the same friction point: the gap between "Book" and "Tax." A client hands over a folder—digital or physical—stuffed with W-2s, 1099s, and bank interest statements. However, when you run the General Ledger (GL) export from their accounting software, the numbers rarely match the source documents perfectly. This is where the battle begins.
For years, the industry has relied on fragile spreadsheets to bridge this gap. You manually key data from PDFs into cells, risking copy-paste errors, or you rely on VLOOKUPs that break the moment a client sends an updated file. On the other end of the spectrum, enterprise ERP modules offer automation but often lack the flexibility required for bespoke client scenarios.
There is a better way. By treating your reconciliation process as a connected workflow rather than a static document, you can automate the ingestion of data and the identification of discrepancies. This article explores how modern accountants are using Quadratic to master tax reconciliation, turning a tedious manual tie-out into a dynamic, audit-ready variance analysis.
What is tax reconciliation?
At its core, tax reconciliation is the process of adjusting financial accounting net income (Book Income) to determine taxable income. It is not simply checking the math; it is the bridge that explains why the numbers reported to shareholders or management differ from the numbers reported to the IRS.
The complexity of this landscape has grown significantly over time. Legislative changes often introduce new layers of compliance and calculation. From the historic Economic Growth and Tax Relief Reconciliation Act to modern proposals often referred to as a reconciliation tax bill, shifting regulations constantly alter allowable deductions and timing differences.
For the accountant, this means the "rules" of the reconciliation are always in flux. A rigid software tool might not update fast enough to handle a specific niche deduction, while a standard spreadsheet offers flexibility but lacks the power to handle the data volume and logic required for complex returns.
The modern workflow: moving beyond "plug numbers"
The traditional approach to this workflow is familiar but flawed. It usually involves opening a PDF on one monitor and a spreadsheet on the other, manually typing in totals from W-2s and 1099s. This creates "hard-coded" numbers. If the client realizes they forgot a contractor's 1099 and sends a new file, the accountant has to find every cell that referenced the old total and manually update it. This is where version control fails and audit risk increases.
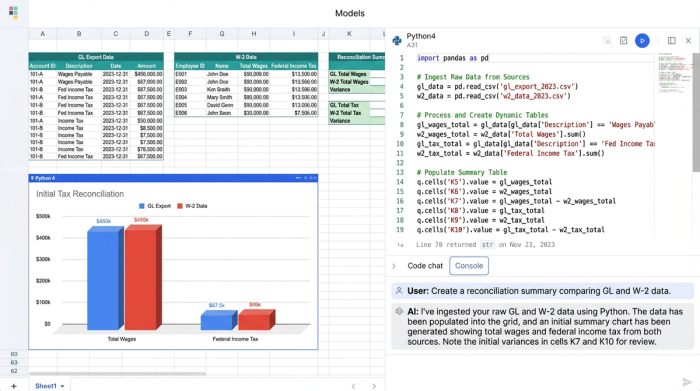
In a modern workflow using Quadratic, the process changes from data entry to data orchestration. Instead of typing numbers, the accountant uses Python or built-in data connectors to ingest raw data directly into the canvas.
For example, a tax preparer can pull raw payroll CSVs, bank interest statements, and prior-year carryforward schedules directly into the workbook. By using Python to read these files, the data remains connected to the source. If the source file is updated, the workbook updates automatically. This eliminates the need for "plug numbers" to force a balance and allows the accountant to focus on investigating the variance rather than fixing the spreadsheet.
Step-by-step: consolidating source documents & flagging variances
Building a reconciliation engine in Quadratic allows you to mimic the logic of expensive software while retaining the customizability of a spreadsheet. Here is how a tax professional can structure this workflow to consolidate inputs and flag variances.
Centralize the inputs
The first step is moving away from scattered tabs. In Quadratic, you can set up specific data grids for different document types. You might have one section dedicated to W-2 data, another for 1099s, and a third for the General Ledger export. Because Quadratic handles data like a database, you aren't limited by row counts or slow performance. You can import the full detail of a payroll summary—thousands of rows—without the workbook crashing.
Automate the comparison
Once the data is in the system, you need to compare the source documents against the books. detailed calculations, such as a premium tax credit reconciliation (Form 8962), require precise logic that manual entry often compromises.
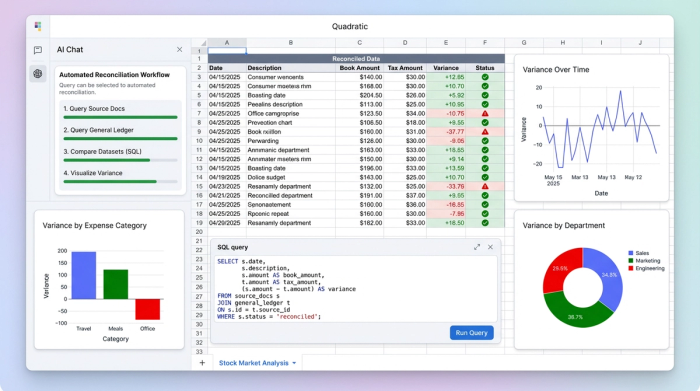
In Quadratic, you can use SQL directly within the sheet to query your data. Instead of a fragile cell reference, you might write a query that sums the total taxable wages from your W-2 dataset and compares it immediately against the payroll expense account in your GL dataset. The logic is visible and readable, ensuring that the comparison is performing exactly as intended.
The variance explanation sheet
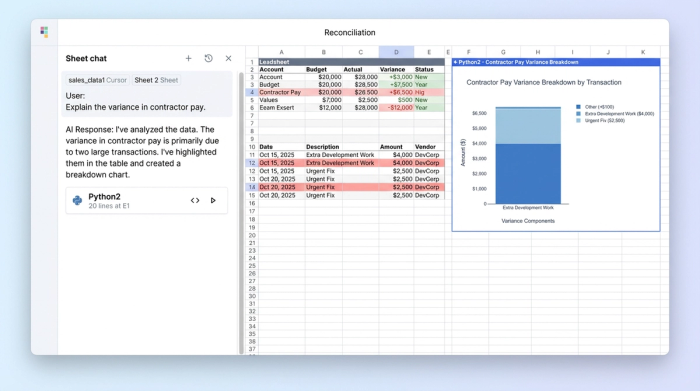
The final output is a dynamic "Leadsheet." This is a summary view that acts as your dashboard. It lists the source document totals in one column, the GL totals in another, and calculates the variance in a third.
You can program this sheet to highlight discrepancies in red automatically. When a variance appears—perhaps a $5,000 difference in contractor pay—you know immediately that the GL shows more expense than the 1099s support. This allows you to ask the "Why" questions faster: Is it a timing difference? Is there a missing form? Did a reimbursement get booked as compensation?
While Wolters Kluwer tax and accounting bank reconciliation features set a high industry standard for automation, they operate as a "black box." Quadratic allows you to build this same logic transparently, giving you full control over how matches are made and how exceptions are flagged.
Why "leadsheets" and "source of truth" matter
The primary value of this approach is risk reduction. In a standard spreadsheet, the logic is hidden inside cell formulas like =Sum(Sheet1!A1:A50). If a row is added to Sheet1, the formula might miss it.
In a programmable canvas, the logic is explicit. The code serves as an audit trail. If an auditor or a senior partner asks how a number was derived, you can show the Python script or SQL query that aggregated the data. This creates a single source of truth that is defensible and transparent.
Furthermore, this setup supports real-time updates. In the heat of tax season, clients frequently send corrected forms. In a manual workflow, a corrected 1099-NEC requires re-opening the workpaper, finding the manual entry, updating it, and checking to see if it broke any downstream formulas. In Quadratic, you simply update the dataset. The variance analysis refreshes instantly, showing the new status of the reconciliation.
Frequently asked questions
How does a tax reconciliation bill impact my workflow?
Legislative changes, often stemming from a reconciliation tax bill, frequently alter the rules regarding deductibility and income recognition. When these laws change, software vendors can take weeks or months to patch their systems. By building your own workflow in a flexible tool like Quadratic, you can adjust your logic immediately to account for new rules without waiting for a vendor update.
Can I automate bank reconciliations without enterprise software?
Yes. While many firms rely on specific enterprise tools, you can build custom matching logic in Quadratic. By importing bank statements and GL exports, you can use Python to write scripts that match transactions based on date, amount, and description, effectively automating the "tick-and-tie" process for a fraction of the cost.
Conclusion: build your own reconciliation engine
Tax reconciliation is the final line of defense against audit risk and financial misstatement. For too long, accountants have had to choose between manual data entry in spreadsheets or rigid, expensive enterprise modules.
Quadratic offers a third path. By turning your workpaper into a workflow, you can ingest data automatically, define your own matching logic, and create a dynamic variance analysis that updates in real-time. Don't settle for manual entry or black-box software. Use Quadratic to build a transparent, automated reconciliation workflow that consolidates your W-2s, 1099s, and GL data in one dynamic workspace.
Try Quadratic, the AI spreadsheet that does your work for you
Use Quadratic to do tax reconciliation
- Automate data ingestion from W-2s, 1099s, general ledgers, and bank statements directly into your workbook.
- Eliminate manual data entry and "plug numbers" by connecting data to its source, ensuring automatic updates with new files.
- Centralize all client tax documents and ledger data in a single, high-performance workspace without spreadsheet crashes.
- Use native Python or SQL to define precise comparison logic, transparently identifying book-to-tax variances.
- Generate dynamic leadsheets that automatically highlight discrepancies, allowing you to focus on investigating anomalies faster.
- Create an audit-ready workflow with explicit code serving as a clear audit trail and single source of truth.
- Adapt quickly to legislative changes by instantly updating your custom reconciliation logic, rather than waiting for vendor software patches.
Ready to streamline your tax season? Try Quadratic.