
Modern cities operate under immense financial pressure. Municipalities and private developers alike are tasked with modernizing aging facilities while strictly adhering to budget constraints. In this landscape, urban infrastructure upgrades are no longer just about pouring concrete or repaving surfaces; they are about integrating smart technology, such as Intelligent Transportation Systems (ITS), automating revenue collection, and ensuring long-term financial sustainability.
The challenge for urban planners and finance professionals lies in the tools they use to plan these projects. Many professionals still rely on static spreadsheets to estimate the costs of complex systems. These templates work well for simple lists, but they often break down when variables change. If a stakeholder decides to switch from manual ticketing booths to AI-based license plate recognition, a static spreadsheet often requires a manual rebuild of the financial model to account for the shift in hardware, software licensing, and maintenance.
To solve this, professionals are turning to dynamic financial modeling. By using Quadratic, planners can build a flexible cost assessment model that adapts to design changes, currency fluctuations, and regional pricing instantly. This article demonstrates how to construct a living model for a parking system upgrade that serves as a powerful decision-making tool.
The economics of urban infrastructure upgrades
The stakes for urban infrastructure upgrades are high. A miscalculation in the planning phase can lead to budget overruns that stall projects or leave cities with maintenance costs they cannot sustain. Therefore, the financial assessment must offer granular cost transparency, separating immediate costs from long-term liabilities.
When modeling these upgrades, expenses generally fall into two distinct buckets. The first is Capital Expenditures (CapEx), which includes the initial investment for civil works, hardware installation, and architectural design fees. The second is Operational Expenditures (OpEx), encompassing recurring costs such as software subscriptions, energy consumption, equipment maintenance, and staffing.
For a parking system, the ultimate goal of this assessment is financial justification. The model must prove to management that the revenue generation—driven by parking fees and improved enforcement—will cover both the initial CapEx and the ongoing OpEx within a reasonable payback period. A dynamic model allows you to see how changes in CapEx (like buying better cameras) might reduce OpEx (by lowering staffing needs), helping you find the sweet spot for return on investment (ROI).
Why static spreadsheets fail complex projects
Most traditional cost estimation tools offer a snapshot in time. You input the costs for a specific set of hardware, and the sheet gives you a total. However, real-world project planning is rarely linear. It involves a workflow of iteration. Stakeholders will inevitably ask to refine estimates based on new technologies or budget cuts.
In a static spreadsheet, refining estimates often means manually tracing formulas across multiple tabs or copy-pasting new data, which introduces a high risk of human error. This rigidity makes it difficult to compare different approaches side-by-side.
Quadratic offers a distinct advantage for this type of complex modeling. Its infinite canvas allows you to build different scenarios—such as "Tower Systems" versus "Surface Lots"—side-by-side in a single view. Furthermore, because Quadratic integrates Python and SQL directly into the grid, you can pull in tabular financial data from external databases or clean raw CSV files programmatically. This ensures your data remains a reliable source of truth, rather than a brittle set of hard-coded numbers.
Step-by-step: Building your dynamic parking cost model
To move from a static list to a dynamic tool, you need to structure your data effectively. The following workflow outlines how a finance professional can build a parking cost assessment in Quadratic.
1. Ingesting tabular financial data
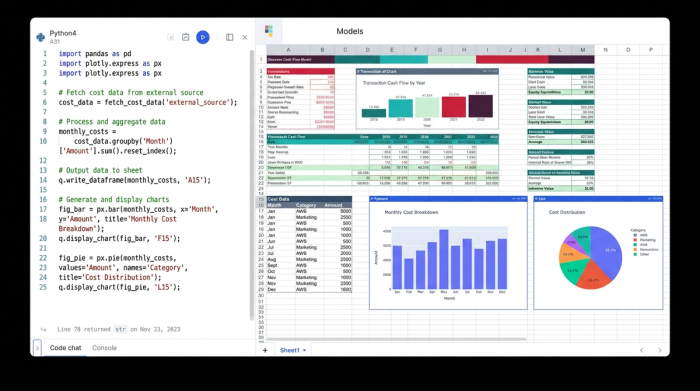
The foundation of any robust model is accurate unit pricing. Instead of manually typing in prices for asphalt, sensors, gates, and signage, you can import raw cost data directly into Quadratic. If your pricing data resides in a database or a CSV file, you can use Quadratic’s Python integration to ingest this tabular data.
By treating this imported data as your master price list, you create a single source of truth. If a vendor updates the price of a payment kiosk, you update it once in the master list, and every calculation in your model referencing that item updates automatically.
2. Categorizing expenses
Once your data is in the system, the next step is to break the project down into specific line items. Research into successful urban infrastructure upgrades suggests categorizing expenses to identify where the budget is heaviest.
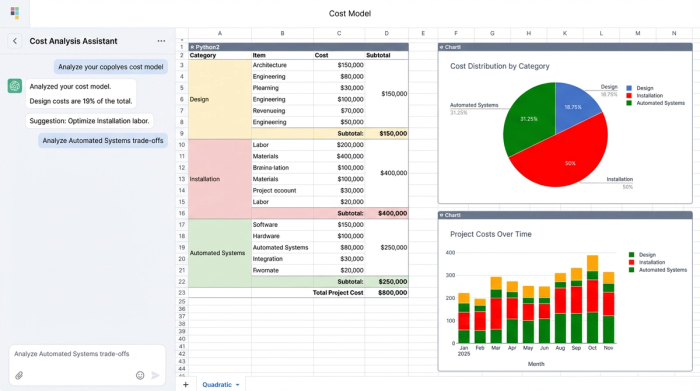
- Design: This includes architectural planning, engineering permits, and consulting fees.
- Installation: This covers physical labor, civil works, trenching for cables, and concrete pouring.
- Automated systems: This represents the "smart" infrastructure, including license plate recognition cameras, automated barriers, and payment kiosks.
In Quadratic, you can organize these into distinct sections on the grid. By calculating section totals for each category, you gain immediate visibility into the cost structure. For example, you might see that while the "Automated Systems" category has a high upfront cost, it significantly reduces the "Installation" costs required for physical booths.
3. Handling regional pricing and currency
Infrastructure projects often span different regions, requiring calculations in specific currencies based on local pricing, necessitating careful managing currency risk. In a static sheet, converting a project from USD to EUR or adjusting for a regional labor markup often involves rewriting formulas cell by cell.
In a dynamic model, you can set up a variable cell for "Exchange Rate" or "Regional Markup." You then reference this cell in your Grand Total calculations. By changing this single variable, the entire model recalculates the total project cost in the specified currency. This capability is essential for multinational firms or planners working with imported hardware.
Scenario planning: Refining the estimate
The true power of a dynamic model is realized during the refinement phase, demonstrating the key benefits of scenario planning when management asks, "What if we add more digital signage and reduce the number of manual payment booths?"
In a traditional workflow, this might require an afternoon of reworking the spreadsheet. In Quadratic, you can design your model to handle these questions live. You can set up a "Project Components" section where you define the quantity of each item (e.g., Digital Signage = 0).
When you change the quantity of "Digital Signage" from 0 to 10, the model instantly triggers a chain of updates. The Installation Total increases to account for the new screens. The Electrical OpEx adjusts to reflect the power consumption of the new devices. Consequently, the 5-year ROI projection updates to show how the additional cost impacts the payback period.
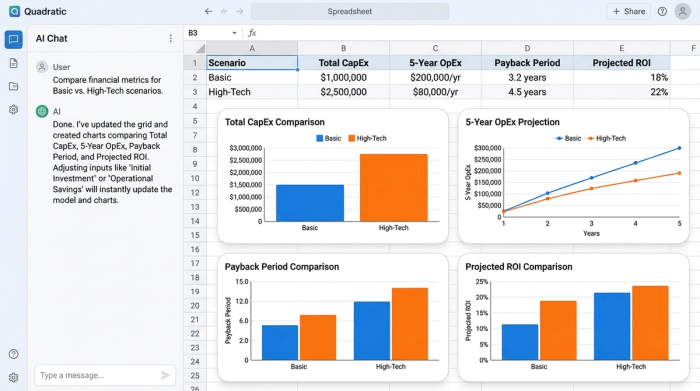
You can further enhance this by using Quadratic’s graphing capabilities. By visualizing the cost difference between a "Basic" upgrade and a "High-Tech" upgrade on a chart, you make the financial impact of these decisions immediately clear to non-technical stakeholders.
Finalizing the assessment for decision making
The output of this process is a comprehensive financial assessment that does more than just list a price tag. It tells a story about the project's viability. When presenting to stakeholders, your model should highlight operational sustainability, demonstrating that the ongoing maintenance costs of the new automated system will not outpace the revenue it generates and ensuring project profitability.
By moving away from rigid templates and adopting a dynamic approach, you transform the budgeting process from a clerical task into a strategic advantage. Start building your dynamic urban infrastructure upgrades model in Quadratic today to ensure your financial planning is as smart as the systems you are building.
Use Quadratic to do urban infrastructure upgrades
- Build dynamic cost assessment models that instantly adapt to design changes, currency fluctuations, and regional pricing for complex projects like parking system upgrades.
- Achieve granular cost transparency, separating capital expenditures (CapEx) from operational expenditures (OpEx) to ensure long-term financial sustainability.
- Design and compare multiple project scenarios side-by-side on an infinite canvas, making it easy to evaluate different approaches (e.g., "Tower Systems" versus "Surface Lots").
- Ingest tabular financial data directly from external databases or CSV files using Python, creating a single, reliable source of truth for unit pricing and vendor updates.
- Manage regional pricing and currency conversions by adjusting a single variable, automatically recalculating total project costs for multinational planning.
- Refine estimates live with powerful scenario planning, instantly updating costs, OpEx, and ROI projections when project components or quantities change.
- Visualize cost differences and financial impact with built-in graphing capabilities, making complex decisions clear to all stakeholders.
Start building your dynamic urban infrastructure upgrades model in Quadratic today and Try Quadratic.