
James Amoo, Community Partner
Feb 23, 2026

Table of contents
- Step 1: Define the strategic question and hypotheses
- Step 2: Design the data collection strategy
- Step 3: Processing and synthesizing evidence
- Phase 4: Integrating insights for a complete picture
- Phase 5: Validating findings and recommendations
- How Quadratic streamlines research and data analysis
- Conclusion
- Frequently asked questions (FAQs)
Modern product and strategy teams often find themselves in a paradox: they have an increasing influx of data but are slow to generate insights. They have comprehensive dashboards tracking every user interaction and folders full of customer interview transcripts, yet they struggle to connect the two. Quantitative data analysis tells you what is happening, while qualitative research explains why it is happening. When these two streams remain siloed in different tools, decision-making becomes a herculean task.
To solve complex business problems, teams need to bridge this gap. Effective research and data analysis in a business context is the disciplined synthesis of user behavior metrics and user sentiment, often referred to as mixed-methods research. It is not enough to simply run a database query or summarize a few sales calls.
To drive strategic decisions based on your data, teams must move beyond ad hoc reporting and adopt a solid data infrastructure and analytics that include a structured workflow and integrate qualitative and quantitative evidence in a single environment. This blog post will explore a 5-step approach to turn research and data analysis into actionable insights.
Step 1: Define the strategic question and hypotheses
Great analysis starts with a specific question, which guides the hypothesis-driven approach to data exploration rather than aimlessly browsing a database. The most common mistake analysts make is diving into data extraction before fully understanding the business problem. Without a clear objective, you risk finding interesting correlations that have no impact on your research strategy.
Start by defining the essence of your research. If the broad concern is that revenue is down, drill down until you have a specific problem statement. For example, "Revenue is down because churn has increased, specifically in the mid-market segment."
Once the problem is defined, move to hypothesis generation. This is a critical step in creating effective data analysis methods for qualitative and quantitative research. A strong hypothesis transforms a vague curiosity into a testable statement.
Instead of asking "Why is churn up?", you might hypothesize: "Churn is increasing in the mid-market segment because the recent pricing change removed a key feature they relied on." This statement gives you clear criteria to prove or disprove.
Step 2: Design the data collection strategy
With a hypothesis in hand, you can now identify the specific ingredients required to test it. A robust evidence plan rarely relies on a single source of truth; it requires a mix of inputs to build a defensible case.
First, identify your quantitative sources. These are your live metrics, such as usage logs, transaction data, or funnel conversion rates. This data provides the scale and magnitude of the problem. For the churn hypothesis, you would need cancellation logs, usage frequency data for the removed feature, and account segment attributes.
Second, identify your qualitative sources. These provide the necessary context. You might look at support tickets tagged with "pricing," transcripts from exit interviews, or notes from sales calls.
Using data analysis techniques for qualitative and quantitative research together is essential. Quantitative data gives you the "what" and the scale, ensuring you aren't over-indexing on a vocal minority. Qualitative data gives you the "why" and causality, ensuring you aren't misinterpreting a correlation. Designing a collection strategy that includes both ensures your final recommendation is grounded in reality.
Step 3: Processing and synthesizing evidence
This phase represents the core work of the analysis cycle. It involves moving from raw collection to structured processing. In many organizations, this is where the workflow breaks down because the data lives in a SQL editor while the notes live in a document, forcing the analyst to context-switch constantly.
Effective research data processing and analysis require bringing these inputs into a central workspace. For quantitative data, this means cleaning raw SQL outputs, handling missing values, and structuring tables for visualization. For qualitative data, it involves tagging interview notes or categorizing support tickets to identify recurring themes.
The goal here is data blending. You want to use your quantitative data to validate qualitative feelings, and vice versa. If customers say they are leaving because the software is slow, but server logs show improved latency, there is a mismatch that requires deeper investigation. Perhaps the slowness is a UX workflow issue, not a technical one. By performing data analysis in qualitative and quantitative research simultaneously, you can catch these nuances early.
Phase 4: Integrating insights for a complete picture
Once the evidence is processed, the next step is data integration, where you merge the streams to form a cohesive narrative. This is where you turn information into insight.
The most powerful way to do this is by contextualizing the numbers. A line chart showing a drop in engagement is just a statistic. However, if you annotate that drop with a direct quote from a user explaining their frustration, you tell a data story. Data analysis for qualitative and quantitative research is most effective when these elements sit side-by-side.
Modern workflows should favor live data over static snapshots. Traditional reports often rely on pasting screenshots of charts into a slide deck. As soon as the deck is exported, it becomes stale data. A live environment allows you to overlay qualitative context onto real-time data feeds. This ensures that if the underlying metrics change, your analysis remains current and your recommendations remain valid.
Phase 5: Validating findings and recommendations
Before presenting your findings to stakeholders, you must ensure they are defensible. The validation phase is about stress-testing your conclusions to ensure they aren't the result of confirmation bias.
Create a validation checklist. Did you only look for data that supported your hypothesis? Did you ignore a customer segment that contradicted your findings? Use different cuts of the data to see if the trend holds up across various timeframes or user cohorts.
Finally, translate the insight into action. Market research and data analysis should ultimately lead to a decision. Avoid ending with conclusions like "users are confused." Instead, frame the recommendation clearly: "Because users are confused by the new navigation, leading to a 15% drop in feature usage, we recommend reverting the menu structure for mid-market accounts while we A/B test a new design."
How Quadratic streamlines research and data analysis
The biggest pain point in this process is usually the tool stack. Analysts often have to write Python and SQL in one tool, perform data cleaning in a spreadsheet, read interview notes in a document app, and paste everything into a presentation. This disjointed workflow makes it difficult to see the full picture and nearly impossible to reproduce the analysis later.
Quadratic solves this by providing 3 key advancements to traditional spreadsheets: direct connections to databases, AI for research and data analysis, and collaboration. Let’s explore these features in detail:
Direct connection to live data
Quadratic allows you to connect to directly connect to databases, APIs, and raw data, and paste your qualitative research notes onto the same grid. This eliminates context switching and provides analysts with all their research data, all in one environment.
Changes in connected data are also reflected automatically in the spreadsheet or dashboards, so users do not have to always manually trigger a refresh button with every new change in their data.
AI for data analysis and visualization
Combining both quantitative and qualitative data analysis methods can be challenging, even for skilled analysts. It requires a solid knowledge of formulas or the need to learn Python for data analysis.
Quadratic completely erases this friction with its AI spreadsheet analysis feature. Users can simply ask questions about their data in plain English, and Quadratic automatically generates the Python or SQL code for that analysis. Let’s see how it works.
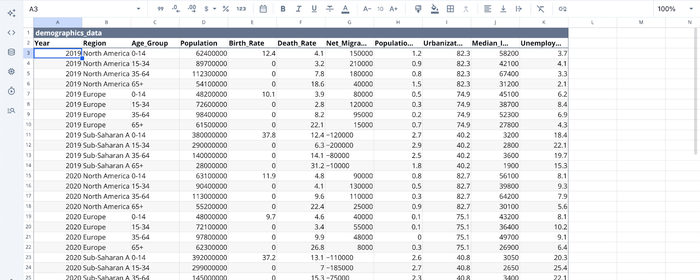
First, I import my data into Quadratic:
Then we can proceed to generating insights immediately. Suppose we want to get insights into the income rate across a specific group:
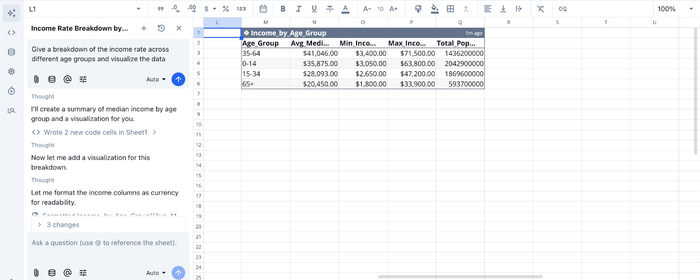
In the image above, I ask Quadratic to “Give a breakdown of the income rate across different age groups and visualize the data”. Quadratic provides the full logic of this analysis, so users can check or modify it to fit their preferences.
With that single prompt, I was also able to get a breakdown of the income rate across all regions and an interactive visualization that I can easily share with stakeholders. Here’s the visualization:

Collaboration
After conducting a comprehensive analysis and visualization of your datasets, the next step is sharing your findings with relevant stakeholders. While other tools may require you to switch across multiple tools to achieve this, Quadratic provides a collaborative analytics platform that provides simultaneous real-time collaboration.
Conclusion
To consistently make good strategic decisions, teams must master the five-step lifecycle of research analysis: Define, Collect, Process, Integrate, and Validate. Moving beyond ad-hoc analysis to a structured research and data analysis ensures that you aren't just reacting to noise but are acting on solid evidence.
The goal is not just to produce a report, but to drive a decision. When you unify your qualitative context and quantitative metrics in a single environment, you reduce ambiguity and increase confidence.
Quadratic allows you to keep your sources, analysis, and visuals in one place and publish a defensible research report. Try Quadratic for free today.
Frequently asked questions (FAQs)
What defines effective research and data analysis?
Effective research and data analysis involve the disciplined synthesis of quantitative user behavior metrics and qualitative user sentiment to solve complex business problems. It bridges the gap between knowing what is happening and understanding why it occurs, leading to strategic decisions.
What are the key phases in research methodology and data analysis?
The process includes five crucial phases: defining the strategic question and hypotheses, designing the data collection strategy, processing and synthesizing evidence, integrating insights for a complete picture, and validating findings and recommendations.
How does Quadratic help streamline research data processing and analysis?
Quadratic provides a unified workspace that combines live data connections, Python, SQL, and AI in a single spreadsheet environment. This allows teams to ingest both quantitative metrics and qualitative notes, analyze them together, and then visualize insights side-by-side, making the workflow seamless and reproducible.
What is the ultimate goal of market research and data analysis?
The ultimate goal of market research and data analysis is to translate insights into clear, actionable recommendations that drive strategic decisions. It aims to move beyond mere reporting to provide concrete guidance for solving business problems and informing future actions.