Template overview
This template centralizes customer survey data into a single analytical view to streamline reporting. By combining Python-based visualization with AI-generated insights, it serves as a dynamic nps calculator for tracking customer sentiment over time. The setup connects raw CSV data directly to interactive dashboards, eliminating the need for complex formulas or manual data manipulation.
Data source configuration
The survey_data sheet acts as the backend repository for the analysis. It contains a hosted CSV file, NPStimeseries.csv, which holds over 5,000 response rows.
For the template to function correctly, the dataset relies on specific columns, including ID, Market, Survey date, and NPS score. The logic standardizes scoring on a 0–10 scale to ensure accurate processing across all visualizations and calculations.
Dashboard visualization components
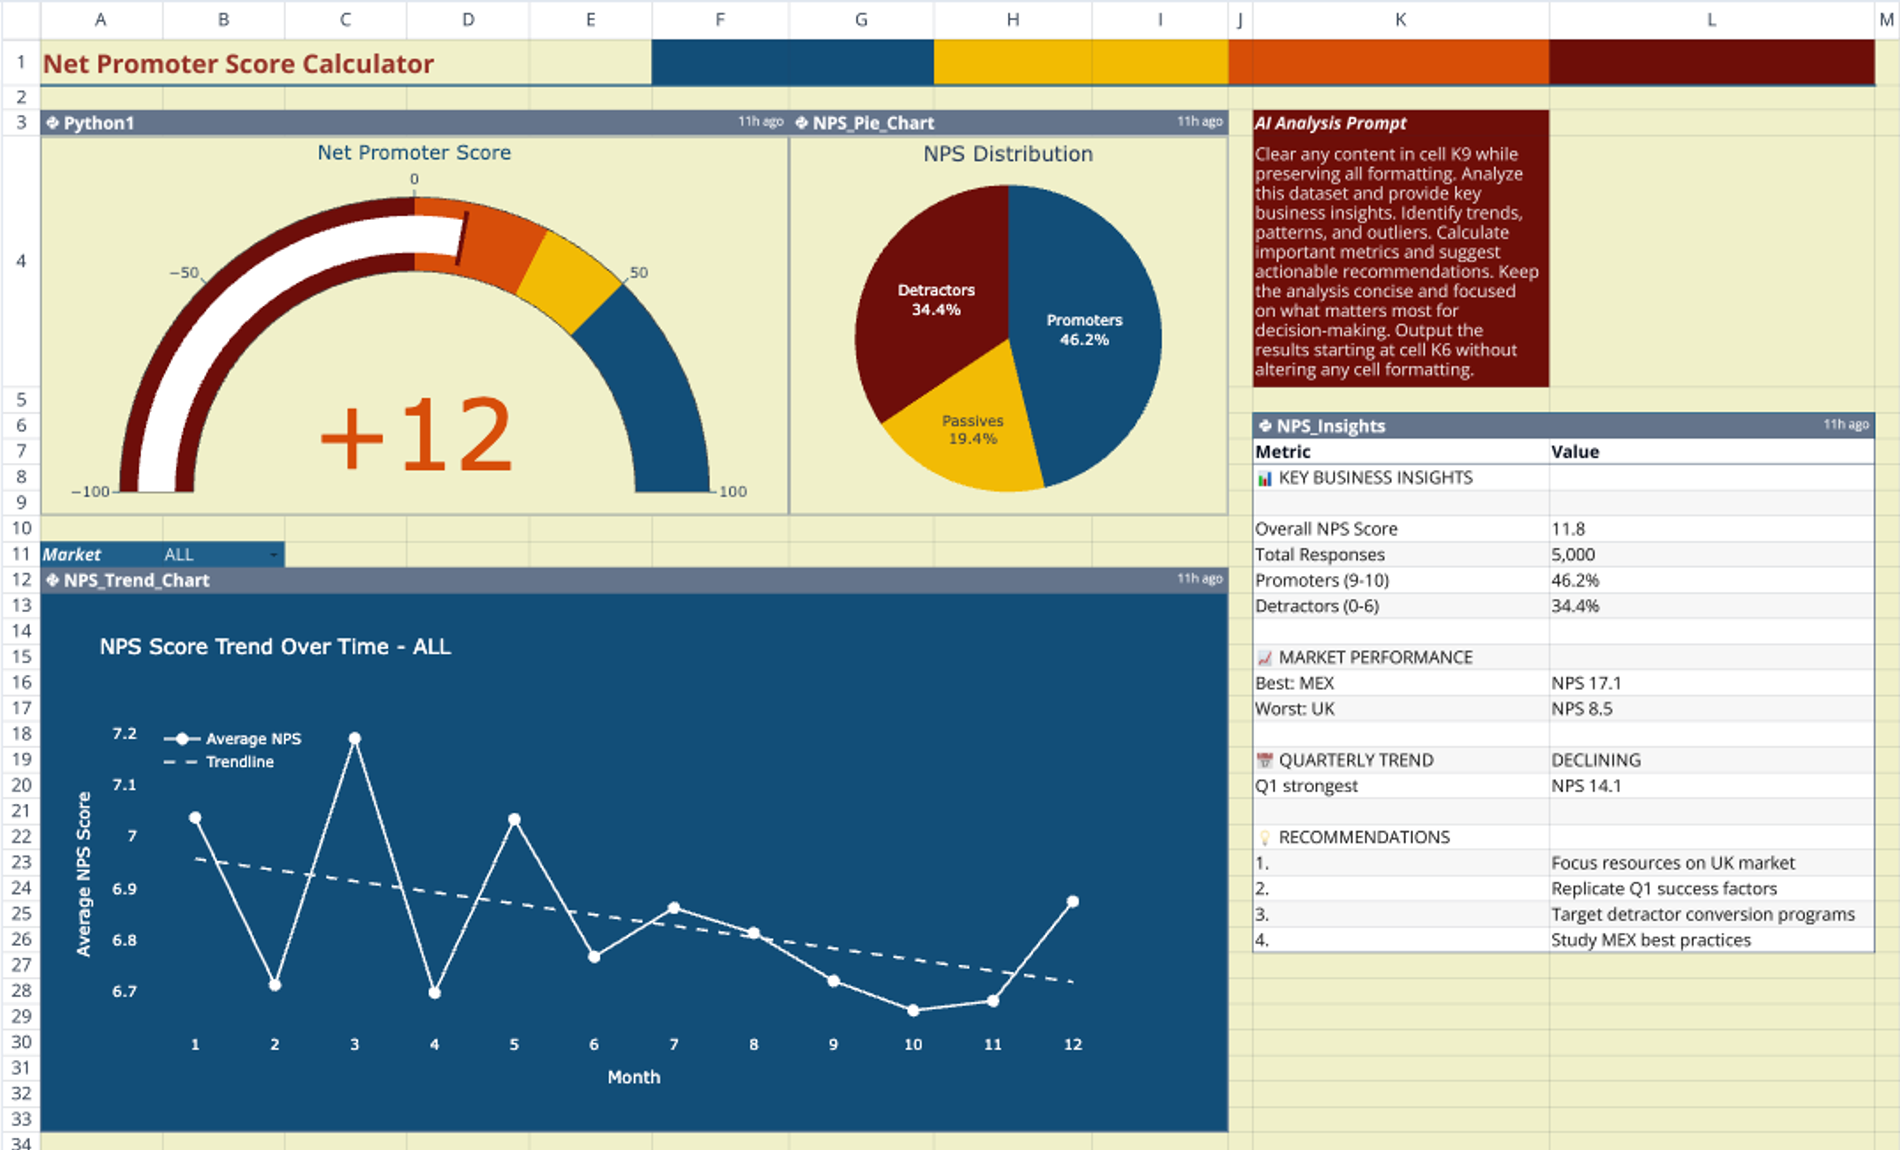
The Dashboard sheet functions as the primary user interface. It utilizes Python code cells to generate three distinct Plotly charts that update automatically when the underlying data changes.
Score distribution
A histogram displays the frequency of specific scores across the dataset. This visualization allows users to see the spread of customer sentiment and identify clustering around specific ratings.
Category breakdown
A pie chart segments users into the three standard NPS categories: Promoters, Passives, and Detractors. This provides an immediate visual reference for the components used in the nps score calculation.
Quarterly performance trends
A line chart tracks score fluctuations across financial quarters. This component helps teams identify directional trends in customer satisfaction and correlate changes with specific business activities.
Automated nps calculation logic
Python scripts embedded in the sheet define the logic for how to calculate nps based on standard industry methodology. The code classifies responses into three groups:
- Scores 9–10 are classified as Promoters.
- Scores 7–8 are classified as Passives.
- Scores 0–6 are classified as Detractors.
The system computes the final metric by subtracting the percentage of Detractors from the percentage of Promoters. Additionally, the scripts aggregate data by market (such as US, UK, and MEX) to allow for granular analysis of regional performance.
AI-assisted analysis features
The template includes a dedicated text block at range K3:K5 containing a pre-written AI prompt. This prompt instructs the system to analyze the dataset and calculate nps score metrics alongside qualitative observations.
The output is generated in a structured insight table located at K6:L26. This analysis highlights top and bottom performing markets and generates actionable recommendations based on the numerical trends identified in the data.
How to use this nps calculator template
- Replace the sample data in the
survey_datasheet with your current survey CSVs. - Ensure that your column headers match the template schema (ID, Market, Survey date, NPS score).
- Refresh the Python cells to update the nps calculation and redraw the Plotly charts.
- Run the AI prompt to generate fresh narrative insights and market comparisons based on the new data.
Who this nps calculator is for
- Customer success managers tracking regional performance and client health.
- Product teams needing to calculate nps trends over time to validate product updates.
- Data analysts requiring a Python-backed template for automated survey reporting.
- Business leaders looking for automated summaries of customer sentiment and market comparisons.
Use Quadratic to do NPS Calculator Dashboard & AI Analysis
- Centralize customer survey data into a single analytical view for streamlined reporting.
- Connect raw CSV data directly to interactive dashboards without complex formulas or manual manipulation.
- Automatically generate Plotly charts for score distribution, category breakdown, and quarterly performance trends.
- Utilize embedded Python scripts for automated NPS calculation and market-specific data aggregation.
- Leverage AI prompts to analyze datasets, calculate NPS metrics, and generate actionable recommendations.
- Update your analysis quickly by replacing sample data and refreshing the Python and AI cells.
Related templates
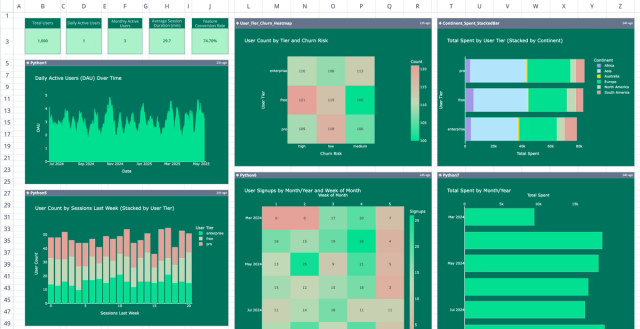
Product User Metrics Dashboard Template
Visualize and analyze user behavior with a comprehensive app usage dashboard.
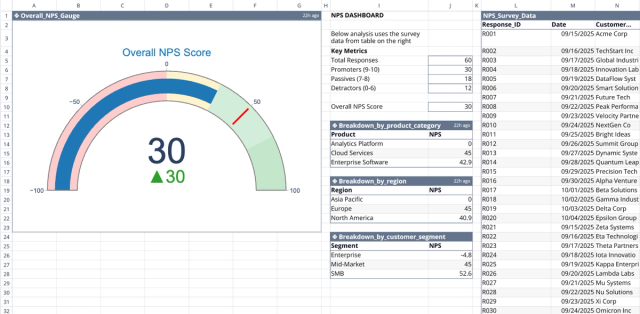
NPS Dashboard Template
Calculate NPS, segment responses, track satisfaction, and reduce churn.

Customer Retention Rate Calculator
Track customer churn, monitor engagement, and visualize retention trends with real-time data.