
Table of contents
Building robust actuarial models for life insurance is a balancing act between massive datasets and intricate logic. Whether you are pricing a new term life product or evaluating the profitability of an existing block, the model must handle mortality tables, lapse rates, and complex cash flow projections without buckling under its own weight.
For decades, the industry has relied on traditional actuarial modeling software or standard spreadsheets to manage this complexity. However, these tools often present a significant risk: the "black box" problem. When a 30-year projection relies on thousands of drag-down formulas and hidden cell dependencies, auditing the logic becomes nearly impossible. A single broken link or a "fat finger" error can compromise the entire pricing structure.
This article explores a modern approach to this challenge through a specific use case: a comprehensive Term Life Pricing model built in Quadratic. By integrating Python for calculation transparency while maintaining a familiar spreadsheet interface, this model bridges the gap between flexibility and auditability. It transforms what is typically a fragile web of formulas into a clean, readable logic flow, setting a new standard for how actuaries approach actuarial modeling.
Structuring the actuarial pricing model
To move away from the "black box" phenomenon, a professional model must be modular. In the context of this use case, the user moved away from the chaotic "everything in one tab" approach and established a clear, component-based structure.
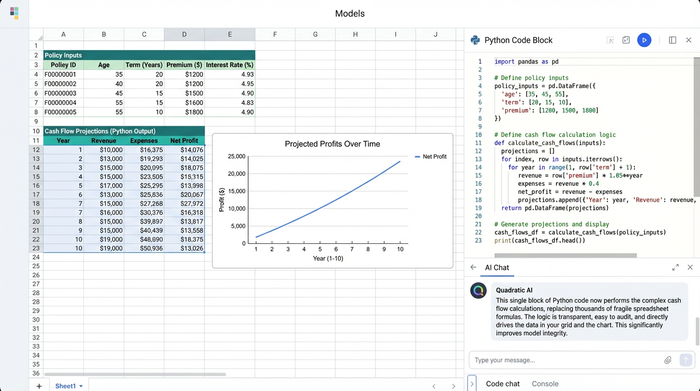
The workflow begins with dedicated "Inputs" and "Assumptions" sheets. This is where the foundation of the actuarial pricing model is laid. The user inputs specific policy data, including age, gender, and coverage amounts. Simultaneously, global actuarial assumptions are established, such as interest rates for discounting, expense loads, and commission structures.
In traditional spreadsheets, input errors are a common source of model failure. A user might accidentally enter a text string into a numeric field or reference a cell outside the intended range. Quadratic addresses this by allowing for strict data typing and validation. By ensuring that inputs are clean before they ever reach the calculation engine, the system functions as a more robust model actuarial pricing system, leveraging advanced data analytics in insurance to significantly reduce the time analysts spend debugging basic data entry errors.
The calculation engine: Python vs. traditional formulas
The core differentiator in this modern workflow is how the cash flow projections are calculated. This is where the debate between "VBA vs. Formulas" usually occurs, but this use case introduces a third, more efficient option: Python.
In a standard spreadsheet, projecting a 30-year term policy often requires dragging complex IF/THEN formulas across 30 columns (for annual projections) or 360 columns (for monthly projections). This creates a heavy file that is prone to crashing and difficult to audit. To understand the logic, an auditor must trace the precedents of a cell in column 360 back through hundreds of other cells.
The user in this case utilized Quadratic’s Python integration to build the calculation engine. Instead of thousands of formula cells, the logic for the entire projection period is written in a single, readable block of Python code. The code loops through the policy duration, applying mortality and lapse rates to the cohort, calculating premiums, and determining reserves.
This shift has a profound impact on auditability. An actuary reviewing the file does not need to hunt for hidden rows or circular references. They can simply read the code to see exactly how the premiums are being derived. This transparency makes the actuarial modeling system more reliable and easier to hand off between team members.
Handling mortality tables and lapse rates
A critical component of any life insurance model is the efficient retrieval of rates from mortality tables, often derived using survival analysis, such as the CSO (Commissioners Standard Ordinary) tables.
In legacy actuarial modelling, this often involves long chains of VLOOKUP or INDEX/MATCH functions that cross-reference age and gender against a massive external table. These functions are computationally expensive and slow down the workbook.
In this Quadratic use case, the user utilized SQL and Python to query these datasets directly within the spreadsheet. By treating the mortality table as a dataframe, the model can instantly pull the correct vector of rates for the specific age and gender cohort. This method is not only faster but also eliminates the risk of reference errors that occur when table ranges are inadvertently shifted.
Profitability analysis and outputs
The ultimate goal of these models is to solve for a premium that satisfies the company’s profit margin targets, a key component of product profitability analysis. This requires comparing the Present Value (PV) of future premiums against the PV of benefits (claims) and expenses.
The "Outputs" section of this model aggregates these calculations into a clear dashboard, providing essential data for P&L analysis. It displays the internal rate of return (IRR) and the profit margin as a percentage of the premium. Because the heavy lifting is done by the Python engine, the dashboard remains lightweight and responsive.
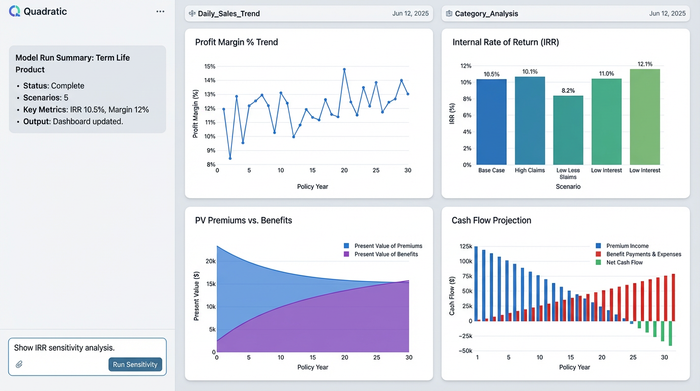
Furthermore, the user leveraged Quadratic’s infinite canvas to visually map the flow of data. Rather than burying the outputs in a tab hidden behind calculation sheets, the canvas allows the inputs, the Python code blocks, and the final profitability dashboard to sit side-by-side. This visual arrangement improves communication with stakeholders, as they can see the direct line from assumption to result without needing to navigate a labyrinth of tabs. These clear visualizations are essential for effective actuarial pricing models, where explaining the "why" behind a price is just as important as the number itself.
Sensitivity testing and scenario analysis
Regulatory requirements and internal risk management demand that actuaries perform rigorous financial stress tests. Stakeholders need to know: "What happens to profitability if mortality rates increase by 10%?" or "What if interest rates drop?"
In traditional spreadsheets, sensitivity analysis can be a slow process. Changing a global assumption often triggers a recalculation of the entire workbook, which can take several seconds or even minutes depending on the file size. This lag discourages real-time scenario testing during meetings.
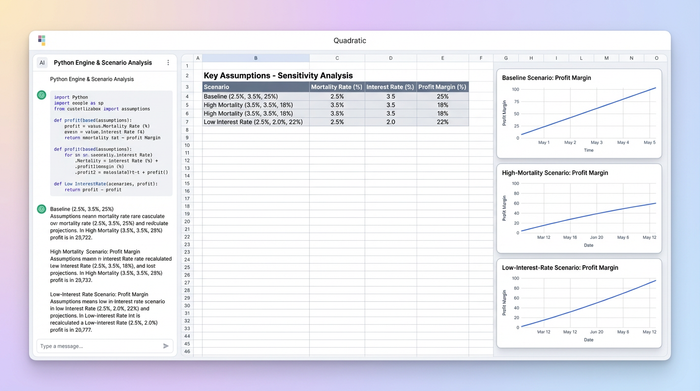
Because this model runs on Python, updating a single assumption recalculates the 30-year projection instantly. The user set up the model to allow for rapid iteration, enabling them to toggle through different economic scenarios, often explored using Monte Carlo simulation, and immediately see the impact on the profit margin. This speed is essential for modern actuarial modeling, allowing teams to make data-driven decisions in real-time rather than waiting for offline batch processes.
The future of actuarial modeling jobs
The shift toward tools that blend spreadsheets with coding reflects a broader trend in the industry. The market for actuarial modeling jobs is evolving. Employers are increasingly looking for "Actuary 2.0"—professionals who possess deep financial and statistical knowledge but also have the technical skills to implement that knowledge using Python or R.
However, the transition away from spreadsheets is not always practical. Spreadsheets remain the lingua franca of finance because of their flexibility. Tools like Quadratic bridge this gap. They allow actuaries to utilize their existing spreadsheet expertise while gradually incorporating the power of code. This hybrid approach empowers actuaries to build better, faster, and more auditable models without having to become full-stack software engineers.
Conclusion & key takeaways
This Term Life Pricing use case demonstrates a significant step forward in how insurance products are priced and analyzed. By structuring inputs clearly, replacing fragile formula chains with Python logic, and visualizing the outputs on an infinite canvas, the user created a model that is both powerful and transparent.
The primary value of this approach lies in the auditability. When the logic is visible and readable, the risk of error drops dramatically. For actuaries and financial modelers, adopting this workflow means spending less time fixing broken spreadsheets and more time analyzing the risks and opportunities that drive the business. As the industry continues to modernize, the ability to combine traditional actuarial rigor with modern data science tools will be the defining characteristic of successful actuarial models.
Use Quadratic to build transparent actuarial models for term life premium & profitability
- Eliminate the "black box" problem: Replace thousands of spreadsheet formulas with transparent, readable Python code for complex cash flow projections, enhancing auditability for 30-year models.
- Ensure data integrity from the start: Apply strict data typing and validation to inputs, preventing common errors before they impact your actuarial calculations.
- Accelerate model performance and scenario analysis: Instantly recalculate 30-year projections and perform real-time sensitivity testing by leveraging Python for the calculation engine and SQL for fast mortality table lookups.
- Improve communication and model handoffs: Visually map inputs, Python logic, and profitability dashboards side-by-side on an infinite canvas, making complex actuarial models clear to stakeholders and team members.
- Modernize your actuarial workflow: Blend familiar spreadsheet functionality with native Python and SQL, allowing you to build robust, auditable models without abandoning your existing expertise.
Ready to transform your actuarial modeling? Try Quadratic.