Cryptocurrency mining has evolved from a hobbyist experiment into a high-stakes financial operation. In the early days, you could plug in a GPU and watch the coins roll in. Today, margins are razor-thin, and profitability relies on strict operational efficiency. For serious operators and investors, the standard "plug-and-play" web calculators are no longer sufficient. They function as black boxes, offering a snapshot of current profitability while ignoring the complex, dynamic variables that determine long-term survival.
To truly understand your return on investment—and to use bitcoin mining cost as a signal for broader market cycles—you need a flexible, transparent tool. You need a financial model that accounts for your specific hardware efficiency, fluctuating electricity tariffs, and even fiat currency exchange rates. By building a custom mining profitability model in Quadratic, you move beyond simple widgets and gain an audit-grade view of your operation.
Does bitcoin mining cost indicate market cycle tops?
Before diving into the mechanics of building your calculator, it is essential to understand why this metric is so closely watched. Search interest often spikes around questions like "does bitcoin mining cost indicate market cycle tops" because the relationship between production cost and market price is a fundamental driver of Bitcoin's economic engine.
Historically, there is a strong relationship between the cost of production and price action. When the price of Bitcoin falls below the average production cost, inefficient miners are forced to shut down. This "miner capitulation" often marks a cycle bottom, as the selling pressure from miners ceases. Conversely, when profit margins are historically wide—meaning the price is significantly higher than the cost to mine—it can suggest the market is overheating.
Traders often look for a bitcoin mining cost as cycle top indicator historical correlation to time their exits. However, relying on global averages can be misleading. "Global hash price" is an aggregate metric. Your personal signal depends entirely on your specific hardware efficiency and local electricity costs. While the macro analysis provides context, you cannot effectively use mining costs as a reliable indicator for your own strategy unless you know your exact numbers.
Why standard "web widget" calculators fail
Most miners start with free online calculators. These tools are useful for a quick check, but they fail when applied to a real business operation. They are rigid models that assume you earn in USD and pay for power in USD. They rarely account for fiat exchange rates, which is a critical oversight for international miners who might earn in Bitcoin (priced in USD) but pay electricity bills in Euros, Yen, or other local currencies.
Furthermore, standard tools usually calculate ROI for a single device. Real operators manage portfolios containing various equipment models with different efficiencies. A static widget cannot model a mixed fleet where some machines are profitable and others are not. They also lack forecasting capabilities. You cannot easily ask, "What if electricity tariffs rise by 10% next month?" or "What if difficulty increases while price remains flat?" To answer these questions, you need a dynamic environment like Quadratic.
Building a dynamic mining calculator in Quadratic
Quadratic offers a unique advantage for this type of modeling because it combines the familiarity of a spreadsheet with the power of Python. Instead of being stuck in a rigid grid, you have an infinite canvas where you can organize data tables, write scripts to pull live pricing, and visualize your breakeven points in one workspace.
Step 1: The input parameters
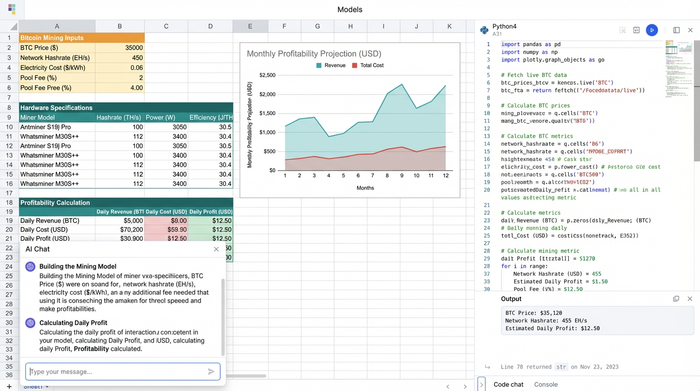
The foundation of your model is your input section. In a standard spreadsheet, these would just be static numbers. In Quadratic, you can use Python to make them dynamic.
First, define your hardware specifications, including hashrate (TH/s) and power consumption (Watts) for each model in your fleet. Next, input your electricity tariffs. This is where custom modeling shines; you can input tiered rates or time-of-use rates rather than a single average cost.
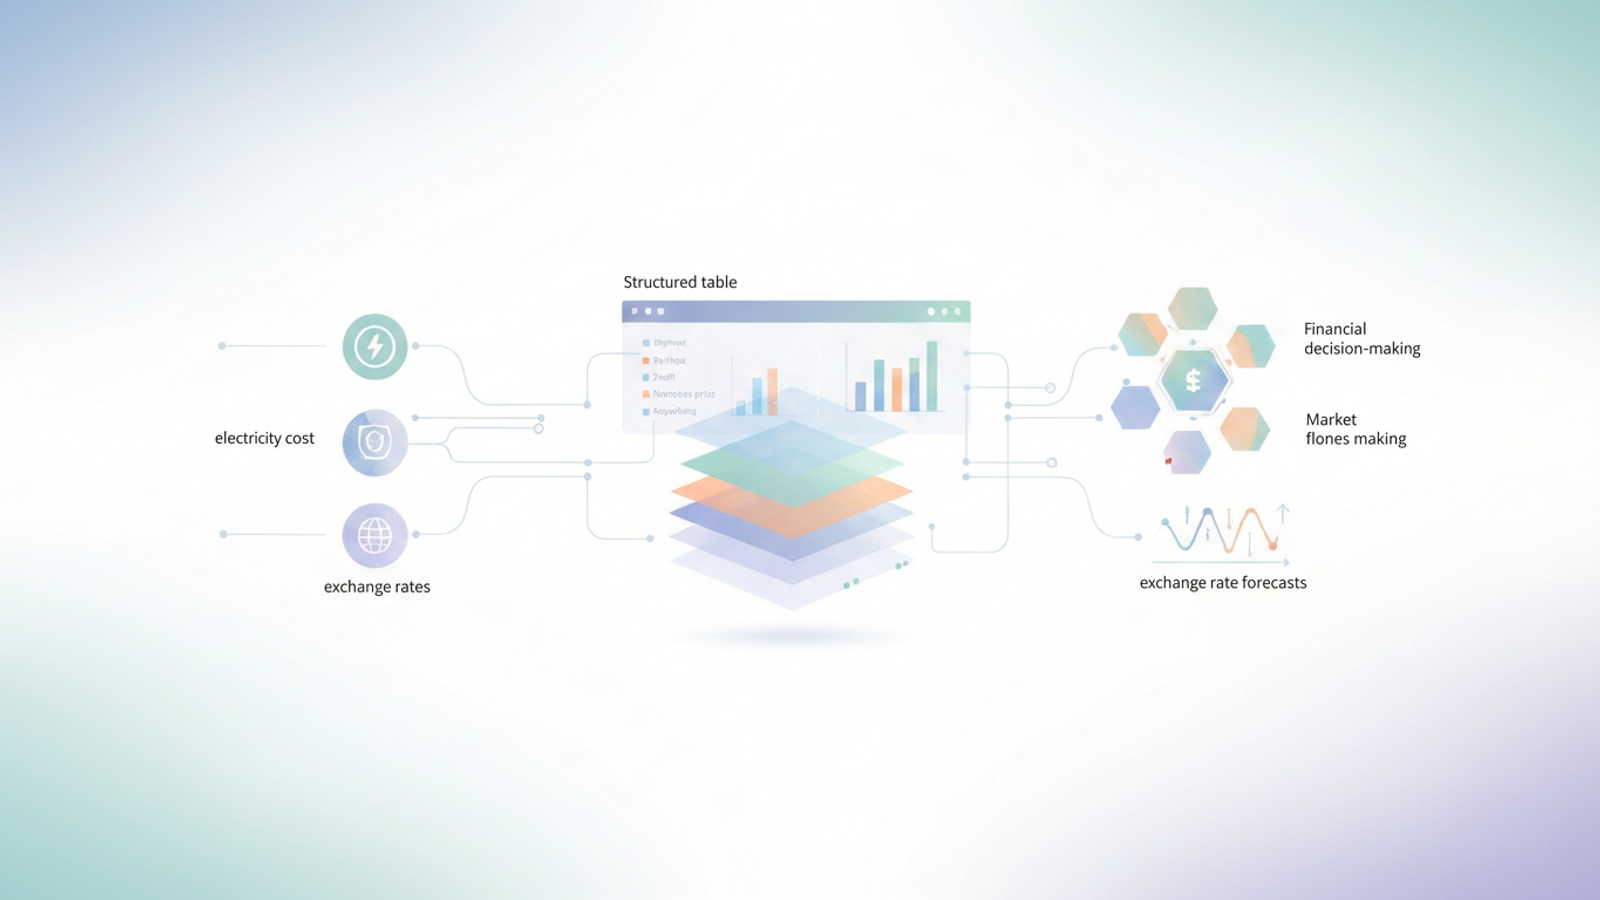
Crucially, you can use Python to pull live data feeds. By connecting to a crypto pricing API, your sheet can automatically update the current Bitcoin price. If you are operating internationally, you can also pull live fiat currency exchange rates. This ensures your model always reflects the reality of the market right now, not what it was last week.
Step 2: Structuring the equipment table
Once your inputs are set, you can build a structured table to manage your fleet. This table should list every equipment model you operate. For each row, calculate the daily electricity cost and the daily cryptocurrency yield based on current network difficulty.
Because you are in a spreadsheet environment, you can easily calculate the gross revenue and net profit for each machine. This granular view allows you to see which specific models are carrying the fleet and which are dragging down your average ROI.
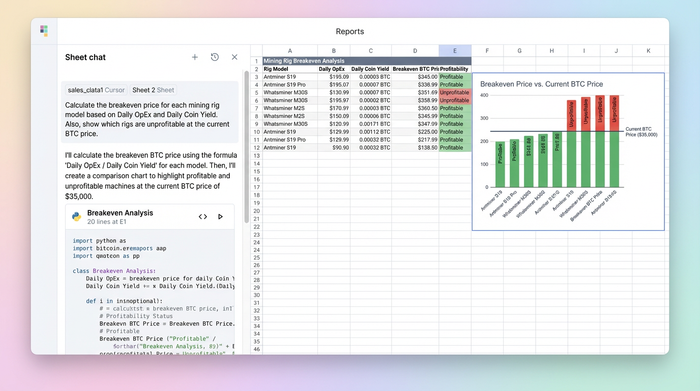
Step 3: The breakeven formula
The most critical metric for any miner is the breakeven price. This is the price at which your mining revenue exactly covers your electricity and operational costs.
The formula logic is straightforward: Daily OpEx / Daily Coin Yield = Breakeven Price.
In Quadratic, you can apply this formula across your entire fleet table. This number tells you exactly when you need to turn off specific machines to avoid unprofitable bitcoin mining costs. Instead of guessing based on market sentiment, you have a hard number. If Bitcoin drops below $25,000 and your S19 Pro’s breakeven is $26,000, you know immediately that the machine is burning cash.
Advanced modeling: Exchange rates and forecasting
For many miners, the relationship between Bitcoin price and local currency strength is a major variable. If your local currency weakens against the dollar, your mining operation might remain profitable even if the Bitcoin price stays flat, because the BTC you mine is worth more in your local currency.
Standard calculators ignore this Forex factor entirely. In Quadratic, you can build a scenario planner that accounts for this. You can model "What if?" scenarios over different time horizons. For example, you can project your profitability if Bitcoin hits $100,000 but mining difficulty increases by 20%, while simultaneously modeling a 5% fluctuation in your local currency.
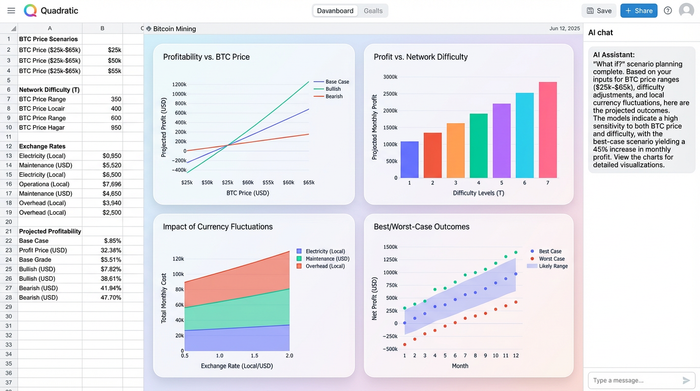
This level of forecasting transforms your spreadsheet from a simple tracker into a strategic decision-making tool. You can visualize these scenarios using Quadratic’s built-in charting or Python visualization libraries, giving you a clear picture of your risk exposure.
Analyzing your results: Are you unprofitable?
Once your calculator is built, the dashboard provides a "shut-off" signal. By applying conditional formatting to your profit columns, you can instantly see which rigs are unprofitable. This protects you from running hardware that costs more to power than it generates in revenue.
This micro-level analysis ties back to the macro market cycle. When you know your true cost of production, you can better understand where you sit in the historical cycle. If your highly efficient machines are approaching their breakeven price, it is highly likely that the broader market is in a capitulation phase. You are no longer guessing about the market bottom; you are calculating it based on your own ledger.
Conclusion
Profitable mining is ultimately an exercise in margin management. Relying on "black box" web calculators leaves you blind to the specific variables that drive your business. By using Quadratic, you can build a transparent, Python-powered mining model that updates in real-time and accounts for the complexities of your specific operation.
Don't guess your costs. Build a model that tells you the truth about your profit, your breakeven price, and your exposure to market volatility.
Use Quadratic to calculate your true Bitcoin mining profit
- Build a dynamic, transparent model that pulls live bitcoin prices and fiat exchange rates, ensuring real-time accuracy.
- Account for specific hardware efficiency, varying electricity tariffs (tiered or time-of-use), and your entire mixed mining fleet in one flexible workspace.
- Calculate the exact breakeven price for each machine, providing a clear "shut-off" signal to prevent unprofitable operations.
- Run advanced "what if" scenarios to forecast profitability under changing market conditions, difficulty increases, or currency fluctuations.
- Gain an audit-grade view of your operation, moving beyond generic averages to understand your true costs and profit margins.
Stop guessing your mining profitability. Build your custom, transparent model and make data-driven decisions. Try Quadratic.