
An ERP migration is one of the most high-stakes projects a finance team will ever undertake, with studies indicating high ERP migration failure rates. It is not simply a matter of moving data from one container to another; it is the process of translating the entire financial narrative of your company into a new language without losing the plot. Whether you are graduating from QuickBooks to NetSuite, or transitioning from a legacy on-premise system to a cloud-based solution like Oracle or SAP, the integrity of your historical data is paramount. If the history is wrong, the future reporting will be wrong, and trust in the new system will evaporate before the ink is dry on the contract.
The most critical point of failure in this process is the "messy middle"—the gap between exporting data from the legacy system and importing it into the new one. Most finance professionals attempt to bridge this gap using standard spreadsheets. However, as transaction volumes grow and mapping logic becomes more complex, traditional spreadsheets often buckle under the weight. They crash, they hide formula errors, and they lack the audit trails necessary to satisfy a rigorous controller.
To guarantee a successful transition, you need more than just a spreadsheet; you need a staging workbench. Quadratic offers a flexible, infinite-canvas environment where you can build, test, and validate your chart of accounts mapping logic using Python and SQL before you ever attempt a final upload. By treating your migration data as a dataset to be engineered rather than a list to be manually edited, you can eliminate the anxiety of data loss and ensure reporting continuity from day one.
Phase 1: The pre-migration assessment
The pre-migration phase is often rushed, with teams eager to get to the "building" phase of the new ERP, but this is where critical data hygiene best practices must be resolved. If you map garbage data to a new system, you will simply have a more expensive version of your old problems.
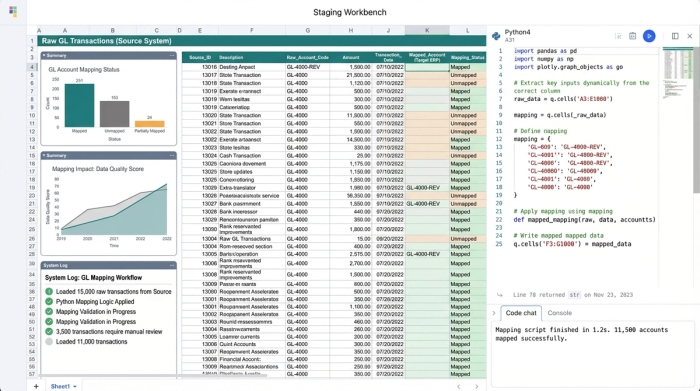
The first step is legacy data extraction. You will need to export your full General Ledger (GL) history and your ending trial balances. In a standard spreadsheet workflow, this is where the headaches begin. A GL export for a mid-sized company can easily exceed row limits, forcing you to break the data into multiple tabs or files. This fragmentation makes it nearly impossible to get a holistic view of your account usage.
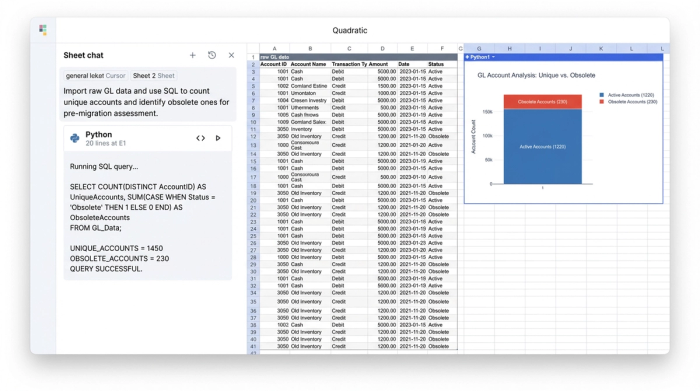
In Quadratic, you can import these massive CSV exports directly into the grid without worrying about row limits. Once the raw data is in, the power of the staging workbench becomes apparent. Instead of scrolling through thousands of rows or trying to construct fragile pivot tables to see which accounts are active, you can use SQL directly within the spreadsheet.
By writing a simple query to select distinct account codes and names from your raw data, you can instantly generate a clean, unique list of every account used in your historical data. This allows you to identify obsolete accounts, duplicates, or accounts that have not been used in years. You can immediately see the scope of the work: do you have 200 accounts to map, or 2,000? This level of visibility transforms the rationalization process from a guessing game into a precise strategic exercise.
Creating your chart of accounts mapping template
Once you have a clean list of legacy accounts, you need to build the bridge to the new structure. This is the core of the migration project. Many consultants will provide a generic Excel file, but a static file cannot handle the nuances of complex financial data. You need to build a dynamic chart of accounts mapping template that serves as the single source of truth for the translation.
Your mapping structure should be explicit. At a minimum, your template in Quadratic should include columns for the Legacy Account Code, Legacy Description, New Account Code, New Description, and the Mapping Logic type. The logic type is crucial because not every account moves in a straight line.
There are generally three types of movement you must account for:
1. 1:1 Mapping: This is a direct transfer, such as moving "Cash - Operating" from the old system to "Cash - Operating" in the new system.
2. Many:1 Mapping: This involves consolidating multiple legacy accounts into a single new category. For example, you might have separate accounts for "Office Supplies," "Printing," and "Postage" in the old system, but you want to map all of them to a single "General Office Expenses" account in the new ERP.
3. Splitting: This is the most complex scenario, where one old account needs to be broken into two or more new accounts based on dimensions like department or location.
In a traditional spreadsheet, handling "Splitting" logic often requires nested IF statements or VLOOKUP formulas that are prone to breaking if the sort order changes. In Quadratic, you can replace these fragile formulas with Python. You can script the mapping logic directly in the cell. For example, you can write a Python script that dictates: "If the old account starts with '6' AND the Department column is 'Sales', map to New Code 5001."
This approach allows you to build complex, conditional logic that is easy to read and audit. Anyone reviewing your work can look at the Python code and understand exactly how the decision was made, rather than trying to decipher a formula bar packed with parentheses. This turns your chart of accounts mapping template into a robust, programmable tool that adapts to your data, rather than a brittle sheet that breaks under pressure.
The "staging area": validating before you upload
The concept of a staging workbench, acting as one of the best financial reconciliation tools, eliminates this risk by allowing you to simulate the migration before it becomes real.
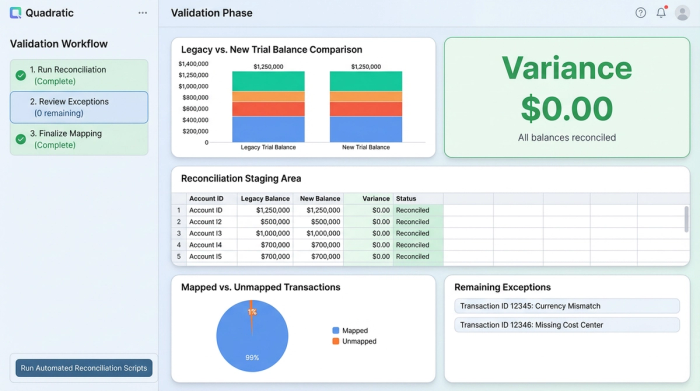
Quadratic acts as a sandbox where you can apply your mapping rules to your historical data without touching the new ERP. You can bring your full historical GL data into the grid and run a Python script that applies your mapping table to perform transaction reconciliation on every single line. This generates a "Simulated New GL" right next to your "Legacy GL."
Once the simulation is run, you can perform automated reconciliation, a critical process for ensuring accurate month end reconciliation. In a standard workflow, this might involve manually checking totals on a calculator or subtotaling columns. In Quadratic, you can write a script to compare the sum of the legacy balances against the sum of the mapped new balances.
You can program the system to flag exceptions automatically. If the variance between the old total and the new total is not zero, the script can identify exactly which line items are causing the discrepancy. This might reveal that a specific legacy account was missed in the mapping table or that a logic rule was applied incorrectly. Because you are in a coding environment, you can iterate instantly: tweak the Python mapping rule, re-run the simulation, and watch the variance drop to zero. This validation process ensures that when you finally do the import, you know for a fact that the numbers will tie out.
Handling suspense accounts and unmapped data
Even with the best planning, some data will inevitably fall through the cracks. In accounting terms, a suspense account is often used as a catch-all bucket for transactions that do not have a clear home. During a migration, however, relying heavily on suspense accounts is a bad practice that leads to messy reporting later.
A robust chart of account mapping strategy uses the staging workbench to identify these orphans before they become suspense items. When you run your simulation in Quadratic, you can query the data to find any rows where the "New Account Code" is null or undefined.
Instead of fixing these errors by manually typing over the data in a CSV file—which leaves no record of what you changed—you can trace the unmapped data back to its source. Perhaps a new department code was created in the final month of the year and wasn't added to the map. You can update your Python mapping script to include this new condition and re-run the process. This ensures that every single dollar is accounted for based on logic, not manual patches.
Finalizing the migration and post-go-live
Once your staging area shows a zero variance and all accounts are mapped, you are ready to execute. The final step in the Quadratic workflow is to generate the upload file. Because your data is already structured and validated, exporting a clean CSV formatted specifically for NetSuite, Oracle, or SAP is a trivial task. You are not exporting a spreadsheet full of formulas; you are exporting the hard values that have been validated by your scripts.
The value of this approach extends beyond the go-live date. One of the biggest challenges post-migration is the audit, where auditors will want to understand your data migration audit requirements and how you arrived at your opening balances. If you used a manual spreadsheet, you might have to point to a cell and say, "I think I typed that number in because we decided to merge those accounts."
With Quadratic, you have a perfect audit trail. You can show the auditor the raw legacy data, the Python script that contains the mapping logic, and the resulting output. You can demonstrate exactly how a balance was derived, proving that the transformation was systematic and consistent. This level of documentation is invaluable for maintaining confidence in the new financial system.
Conclusion
The difference between a painful migration and a seamless one often comes down to the tools used in the middle. Attempting to translate a company's financial history using rigid import tools or fragile spreadsheets invites error and anxiety. By utilizing a staging workbench, you can turn the chaotic process of chart of accounts mapping into a controlled, verifiable engineering task.
The workflow is clear: extract your legacy data, stage and clean it using SQL in Quadratic, build a dynamic mapping template with Python, validate the results through simulation, and only then import to your new ERP. This method ensures that you are not just moving data, but verifying it every step of the way.
Accurate chart of accounts mapping is the foundation of your future reporting. Don't leave it to chance or manual entry. Start your migration project by loading your legacy GL into Quadratic and experience the confidence that comes with full data visibility and automated validation.
Use Quadratic to master chart of accounts mapping for ERP migrations
- Handle massive data volumes by importing full General Ledger histories directly into the grid without row limits, avoiding fragmented data and spreadsheet crashes.
- Efficiently clean and rationalize accounts using SQL to quickly identify active, obsolete, or duplicate accounts, turning your pre-migration assessment into a precise strategic exercise.
- Build dynamic and auditable mapping logic with Python, replacing fragile
IF/VLOOKUPformulas with robust scripts for 1:1, many:1, and complex splitting scenarios. - Validate mappings with a staging workbench by applying rules to historical data and performing automated reconciliations, ensuring zero variance before any ERP upload.
- Proactively resolve unmapped data by querying for exceptions, tracing them to their source, and updating your logic, preventing reliance on messy suspense accounts.
- Generate a complete audit trail that documents raw data, mapping scripts, and validated outputs, providing clear proof of systematic data transformation for auditors.
Ready to ensure a flawless ERP migration? Start building your mapping workbench and gain confidence in your financial data. Try Quadratic