
Table of contents
The month-end close is stressful enough without having to fight with your data. You likely know the scenario well: you are ready to finalize the consolidated budget, but the departmental reports have arrived with slight variations. Marketing sent a file with a column named "Q1 Revenue," while Sales sent theirs labeled "Rev Q1." A junior analyst added a "Notes" column to the Operations file that wasn't there last month.
In a perfect world, every spreadsheet would follow the same template. In reality, you need to combine multiple excel files into one cohesive dataset despite these inconsistencies. When you search for solutions, most tutorials suggest manual copy-pasting or using standard tools like Power Query. While effective for perfect data, these methods often break the moment a column name changes or a new field appears. This phenomenon is known as schema drift, and it is the primary reason so many finance teams spend their late nights fixing broken links instead of analyzing numbers.
There is a more resilient way to handle this. By using Quadratic, you can build a workflow that anticipates these inconsistencies, allowing you to create a trusted, auditable Budget vs. Actual dashboard without needing a degree in data engineering.
Why standard Excel merges fail
When you are trying to figure out how to combine multiple Excel files into one workbook, you often run into the "messy middle" of data preparation. Schema drift is just a fancy way of saying your team changed the spreadsheet columns without telling you. It is rarely a database failure and almost always a result of human nature. People adjust spreadsheets to fit their immediate needs, forgetting that those adjustments break the downstream consolidation process.
Manual copy and pasting is the most common workaround, but it is fraught with risk. It is all too easy to miss a row, paste over existing data, or misalign columns, leading to errors that are difficult to trace. On the other hand, standard Power Query workflows are excellent for identical files but can be brittle. If one file has an extra column or a different header name, the query often fails, requiring you to dive into complex settings to fix it.
Quadratic takes a different approach. It acts as the "engine room" for your data. It does not replace your need for Excel, but rather handles the messy preparation work—ingesting, aligning, and cleaning the data—so that your final analysis is built on a solid foundation.
Step 1: Ingest and auto-detect column mappings
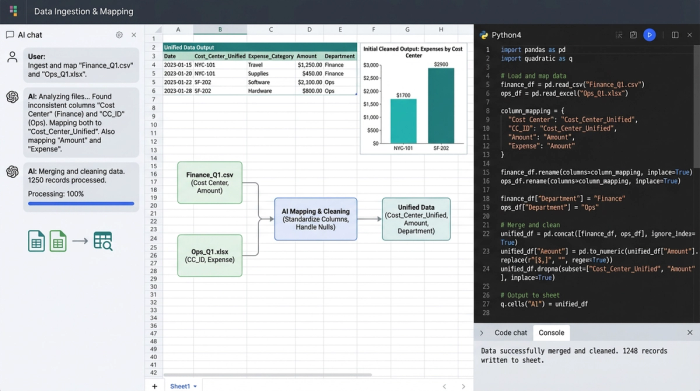
The first step in the workflow involves uploading your monthly departmental files into Quadratic. This is where the difference becomes immediately apparent. When you are looking for how to combine multiple excel files into one spreadsheet, the biggest hurdle is usually mapping the columns manually.
In a traditional workflow, you would have to open every file, rename "CC_ID" to "Cost Center," delete extra columns, and ensure the order matches exactly. Quadratic simplifies this by using intelligent auto-detection. When you ingest the files, the system analyzes the headers. It identifies that "Cost Center" in one file and "CC_ID" in another likely map to the same destination field.
This flexibility allows you to handle files that are 90% similar but have those frustrating 10% differences. You avoid hours of manual re-ordering, and because the logic is handled by the system, you can focus on the content of the data rather than the structure of the file. If you have ever wondered, "how do I combine multiple excel files into one without opening every single one," this automated mapping is the answer.
Step 2: Standardizing headers and aligning formats
Once the initial mappings are proposed, you move to standardization. This is critical when learning how to combine multiple Excel sheets into one file because data formats often vary between departments. One team might use DD/MM/YYYY for their dates, while another uses MM/DD/YYYY.
In this stage, you confirm the mappings Quadratic has detected. The tool then works to align these formats automatically. It takes the disparate inputs and appends the rows into a single, consolidated "Fact Table."
Crucially, this process happens without altering your original source files. The integrity of the data sent by the departments remains untouched. You are simply creating a unified view that sits on top of the raw data. This allows you to combine multiple Excel files into one sheet for analysis while keeping a pristine record of exactly what was submitted.
Step 3: The "trust layer" and reconciliation
Speed is important, but for a Finance Manager, accuracy is non-negotiable. One of the biggest fears when using automation to combine multiple excel files into one workbook separate sheets, such as for automated bank reconciliation, is the "black box" effect—not knowing if data was lost during the merge.
Quadratic addresses this by generating a Reconciliation Report before the final merge is finalized, acting as a powerful financial reconciliation tool. This acts as a trust layer between the raw files and your final dashboard. The report highlights row-count deltas, ensuring that if 5,000 rows went in, 5,000 rows came out. It flags missing columns or unexpected values that do not match the defined schema.
Most importantly, it maintains source file lineage. If there is an error in the consolidated numbers, the report tells you exactly which specific source file caused the discrepancy. This answers the audit anxiety that plagues month-end close, for example, in complex processes like tax reconciliation. You can sign off on the numbers knowing exactly what was merged and where every figure came from.
Step 4: Output to dashboard and export to XLSX
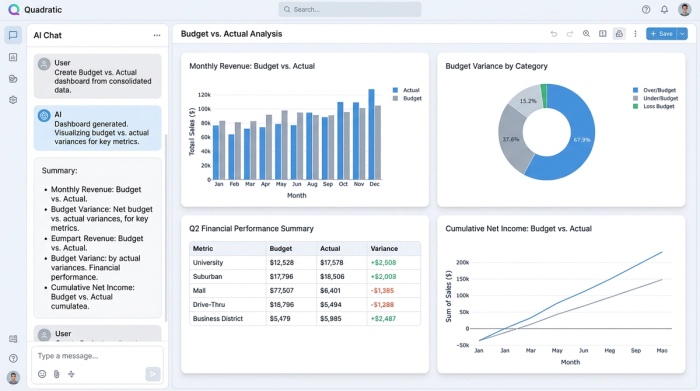
With the data cleaned, aligned, and reconciled, you now have a consolidated dataset ready for action. In Quadratic, this unified data powers your Budget vs. Actual dashboard, allowing you to visualize variances and drill down into specific line items immediately.
However, we know that finance professionals often need to perform ad-hoc modeling in a familiar environment. When you are researching how to combine multiple Excel files into one workbook, the end goal is often to get that clean master file back into a spreadsheet format you can share or manipulate further.
Quadratic supports this hybrid workflow. After the heavy lifting of the merge is complete, you can export the clean, merged master file back as a .xlsx file. This gives you the best of both worlds: the resilience and power of a data engineering tool to handle the merge, and the familiarity of Excel for your final touches and distribution.
Resilience over rigidity
Merging files shouldn't require perfect inputs or a background in coding. The reality of finance is that data will always be messy, and columns will always shift. By using a tool specifically designed to handle schema drift, you transform a fragile, manual process into a resilient and auditable workflow.
Stop fighting with column mismatches and risking errors with manual copy-pasting. By using Quadratic to combine multiple excel files into one trusted dataset, you can turn the chaos of month-end consolidation into a streamlined, accurate process.
Use Quadratic to combine multiple Excel files into one
- Automatically map inconsistent column headers across different departmental reports, eliminating tedious manual renaming.
- Standardize data formats (like dates or currencies) to ensure consistency without altering your original source files.
- Prevent errors and broken links caused by schema drift, making your month-end close and consolidation process resilient.
- Generate detailed reconciliation reports to verify data integrity, confirm row counts, and trace data lineage for auditability.
- Output clean, consolidated datasets for immediate dashboard visualization or export back to .xlsx for further ad-hoc modeling.
Ready to simplify your data consolidation? Try Quadratic