
Table of contents
Every RevOps manager knows the sinking feeling of opening a fresh CRM export. You are looking for insights to drive the next quarter’s strategy, but instead, you are greeted by a wall of chaos: duplicate accounts, inconsistent state abbreviations, missing emails, and formatting disasters that break your pivot tables.
Bad data is more than just an annoyance. It is a silent revenue killer that skews forecast accuracy, sends sales reps chasing the wrong leads, and embarrasses marketing teams when automation scripts send "Hello {First_Name}" emails.
For years, the solution to this problem has been binary. You either slogged through the "Old Way," manually filtering rows in Excel until the file crashed, or you paid for the "Black Box Way," purchasing expensive SaaS cleaning tools that hide their logic behind a sleek UI. If the SaaS tool decided to merge two accounts that shouldn't be merged, you rarely found out until a sales rep complained.
There is a third option. By using a programmable data workspace like Quadratic, you can build a flexible, transparent hygiene workflow. This approach combines the familiarity of a spreadsheet with the power of Python and SQL, giving you total control over how your data is audited, cleaned, and scored.
This guide defines what data hygiene tools really are and walks through a step-by-step workflow to audit, clean, and prioritize your CRM data using revenue impact as your north star.
What are data hygiene tools?
At their most basic level, data hygiene tools are systems designed to detect and correct errors in a dataset. However, for a modern revenue operations team, the definition needs to be broader. These tools are the gatekeepers of truth, ensuring that the information fueling your go-to-market strategy is accurate, consistent, and reliable.
The market for these tools generally falls into three categories:
1. Manual spreadsheets: Tools like Excel or Google Sheets are where most people start. They are accessible but struggle with large datasets and complex logic. Cleaning 50,000 rows manually is not just slow; it is prone to human error.
2. Dedicated SaaS solutions: These are automated platforms that promise to clean your data with a few clicks. While fast, they often suffer from the "black box" problem. You cannot always see the logic driving the decisions, and customizing that logic to fit a unique business model can be difficult or impossible.
3. Programmable workspaces: This is where Quadratic fits in. These environments allow you to interact with data visually like a spreadsheet but use code (Python and SQL) to define the cleaning rules. This offers the automation of SaaS with the transparency and flexibility that technical teams require.
Reliable data leads to reliable revenue forecasting, enabling effective customer data analysis. When you trust the inputs, you can trust the decisions you make based on them.
The core components of data hygiene
To effectively clean a dataset, any tool or workflow must address four specific pillars of data quality:
- Deduplication: Identifying and merging repeated records for the same contact or company.
- Standardization: Ensuring formats are consistent, such as forcing all phone numbers into E.164 format or standardizing state names to two-letter codes.
- Verification: Confirming that contact details, such as email addresses and phone numbers, are valid and active.
- Completeness: Identifying gaps in the data, such as missing job titles or industries, and filling them where possible.
The workflow: building a transparent hygiene engine
The best way to understand the power of a programmable workspace is to walk through a real-world scenario. Imagine a RevOps team dealing with a messy export from Salesforce or HubSpot. The file contains 20,000 leads, but it is plagued by duplicates, stale fields, and inconsistent naming conventions.
Here is how you can tackle this in Quadratic using a transparent, code-backed workflow.
Step 1: Ingest and audit (the "health check")
The first step is pulling the raw CSV or CRM export into Quadratic. Because Quadratic supports SQL queries directly within the sheet, you do not have to rely on scrolling through thousands of rows to spot errors.
Instead, you can run immediate automated quality checks. By writing a simple SQL query against your data, you can instantly profile the dataset. You might query for the count of null values in critical columns like Email or Company Name. You can group records by Country to see how many variations of "United States," "USA," and "U.S." exist.
Unlike a standard spreadsheet where you are passively looking at rows, this approach allows you to interrogate the data. You get an immediate, quantitative "Health Score" that tells you exactly how bad the problem is before you start fixing it.
Step 2: Deduplication and standardization
Duplicates and inconsistent naming conventions are the villains of CRM data. In a traditional tool, you might use a "Remove Duplicates" button and hope it catches everything without deleting unique records.
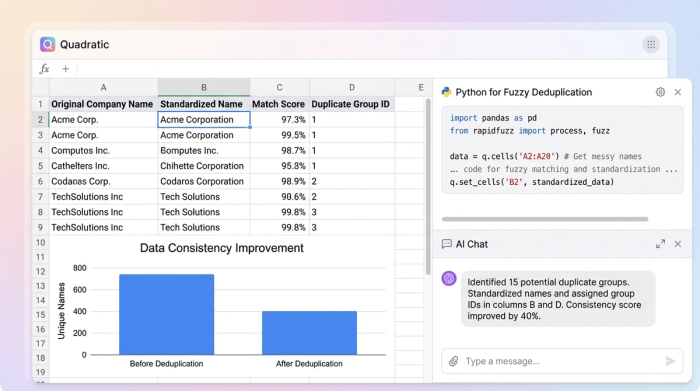
In Quadratic, you can use Python to remove duplicates from list with precision. You can write a script using the pandas library directly in the sheet to perform fuzzy matching. This identifies companies that are likely the same—such as "Acme Inc." and "Acme, Incorporated"—and flags them for review.
For standardization, SQL queries can normalize your data in bulk. You can write a query to trim whitespace, capitalize names properly, or reformat URLs. The critical differentiator here is transparency. You are not clicking a "Merge" button and hoping the software understands your intent. You can see the code logic. If you see that the script is about to merge two distinct global accounts because their names are similar, you can tweak the Python code instantly to prevent the error.
Step 3: Validation and scoring
Binary flags like "Clean" or "Dirty" are rarely helpful in complex B2B sales. A record might have a valid email but a missing phone number. Is that record useless? Not necessarily.
A better approach is to create a "Hygiene Score" per record. Using a Python script or a complex formula, you can assign points to each row based on data quality.
- Valid email address: +10 points
- Standardized phone number: +10 points
- Missing job title: -5 points
- Missing industry: -10 points
This script generates a new column with a numerical score for every lead. Instead of a vague sense of quality, you now have a prioritized list. You know exactly which records are sales-ready and which ones need enrichment.
Prioritizing cleanup by revenue impact
Data cleaning often feels like a chore because teams try to clean alphabetically or chronologically. This is a mistake. To align with revenue goals, you should clean based on potential value.
In Quadratic, you can easily join your newly generated hygiene data with revenue columns like "Deal Size" or "Annual Recurring Revenue (ARR)."
By filtering your dataset to show records with High Revenue Potential and Low Hygiene Scores, you generate a "Cleanup Queue" that directly impacts the bottom line. This ensures that your team spends their time fixing the data for your million-dollar accounts first, rather than wasting hours perfecting the formatting for a low-value prospect. This simple pivot turns data hygiene from an administrative task into a revenue-generating activity.
Why "black box" enterprise-grade customer data hygiene tools fall short
There is a reason technical RevOps leaders often grow frustrated with expensive, enterprise-grade customer data hygiene tools. These platforms are built for the average user, meaning their logic is rigid. If your business model requires a unique definition of what constitutes a "duplicate," you are often out of luck.
The "control gap" in these tools is significant. You cannot see the algorithm, and you cannot change it.
Quadratic offers a distinct advantage through custom control. You write the rules in Python or SQL, meaning the logic fits your business perfectly. It is also iterative. As new data types arrive or your go-to-market strategy changes, you can tweak the code instantly. Finally, the visual verification in the grid allows you to see the "Before" and "After" states side-by-side, ensuring that your cleaning process is improving the data, not corrupting it.
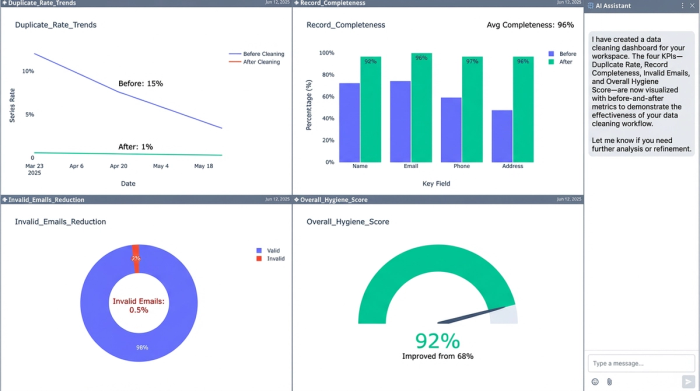
Quantifying success: before/after metrics
The job is not done until you prove the value. A major advantage of keeping this workflow inside a programmable spreadsheet is that you can calculate your success metrics in the same workbook where you did the cleaning.
You can set up a dashboard section that tracks key metrics:
- Duplicate Rate: Show the reduction from X% in the raw export to Y% in the final file.
- Record Completeness: Calculate the percentage of fields filled for your target accounts.
- Bounce Risk: measure the reduction in invalid email formats.
These are the metrics you present to leadership. They justify the time spent on hygiene and demonstrate that the data is now a reliable asset for the sales team.
Conclusion
Data hygiene is not a one-time chore to be dreaded; it is a strategic discipline that supports every revenue goal your company has. When data is clean, forecasts hold up, and sales teams run efficiently.
You do not need to choose between the chaos of manual spreadsheets and the rigidity of expensive, black-box software. By using a programmable workspace, you gain the transparency to trust your data and the flexibility to clean it your way. Start building your custom data hygiene scorecard in Quadratic today and turn your CRM data into a reliable revenue engine.
Use Quadratic to Clean and Optimize Your CRM Data
- Build transparent data hygiene workflows: Combine spreadsheet interaction with Python and SQL to fully control how you audit, clean, and score your CRM data.
- Automate quality checks: Instantly profile CRM exports with SQL queries to identify inconsistencies and generate a quantitative "Health Score."
- Precisely deduplicate and standardize: Use Python for fuzzy matching to catch subtle duplicates and SQL for bulk standardization of formats, ensuring data consistency.
- Prioritize cleanup by revenue impact: Assign a "Hygiene Score" to each record and combine it with revenue data to focus cleaning efforts on high-value accounts.
- Gain full control and visibility: See and modify the Python or SQL logic behind every cleaning rule, adapting quickly to unique business requirements.
- Quantify success directly: Track metrics like duplicate rate reduction and record completeness within your workspace to prove the value of your data hygiene.
Ready to transform your CRM data into a reliable revenue engine? Try Quadratic.