
Table of contents
- What is the Average Bakery Profit Margin?
- Beyond recipe costing: The "hidden" costs killing your margins
- Case study: Building a dynamic pricing engine in Quadratic
- Analyzing profitability: Unit profit & margin percentages
- Conclusion: From static sheets to dynamic strategy
- Use Quadratic to maximize bakery profit margin
In the baking industry, the difference between profit and loss is often measured in pennies. A slight increase in the cost of high-fat butter or a shift in packaging suppliers can quietly erode your bottom line if you aren't paying close attention. For many bakery owners, the passion for the craft comes first, but financial viability is what keeps the ovens running.
The problem many scaling bakeries face is that they rely on static spreadsheets or "back of the napkin" math to calculate their costs. While this works for a home kitchen, it fails when operations become complex. If you are selling the same croissant to a walk-in customer at full price and to a local coffee shop at a wholesale rate, your cost structure and margins are completely different.
To truly maximize your bakery profit margin, you need a dynamic startup financial model—one that separates wholesale (B2B) and retail (B2C) logic, accounts for hidden costs like logistics, and updates in real-time. While industry averages provide a baseline, this article explores how to move beyond simple recipe costing and build a financial engine in Quadratic that reflects the true reality of your business.
What is the Average Bakery Profit Margin?
When financial planning begins, most owners immediately look for benchmarks to see where they stand. It is common to see the industry average profit margins for bakeries cited between 60% and 80% for gross profit. This number represents the revenue remaining after paying for direct ingredients and labor, making strategic labor cost planning for financial sustainability a critical factor. However, the net profit margin—what you actually keep after rent, utilities, and overhead—is significantly tighter, typically hovering between 5% and 10% for successful operations.
These numbers fluctuate heavily depending on the specific business model. A high-volume bread bakery profit margin relies on efficiency and scale, while a home bakery profit margin might look higher on paper because there is no commercial rent to pay. Similarly, a boutique bakery shop profit margin will differ from a wholesale production facility.
While knowing the average profit margin bakery owners aim for is helpful context, relying on it is dangerous. An "average" does not account for your specific tiered pricing, your packaging contracts, or your local delivery fees. If you aim for an industry average without understanding your unique cost drivers, you are flying blind. To secure your financial health, you must move from observing averages to modeling your specific inputs.
Beyond recipe costing: The "hidden" costs killing your margins
Most free costing templates found online focus almost exclusively on the "recipe cost"—the sum of flour, sugar, eggs, and butter. While this creates a baseline for your Cost of Goods Sold (COGS), it ignores the variables that actually drain a bakery business profit margin as it scales, including many common hidden costs in the food industry.
In a recent use case within Quadratic, a bakery owner identified three major "hidden" cost drivers that standard recipe calculators missed:
- Packaging variance: A retail customer requires a branded box, a liner, and a sticker. A wholesale client might receive 50 pastries in a single generic crate. If you apply a flat packaging cost across all units, you are over-costing your wholesale goods and under-costing your retail goods.
- Logistics and distribution: Delivery fees, fuel, and shipping are not fixed overheads; they are variable costs associated with getting the product to the customer. Ignoring these means you might be losing money on every wholesale delivery without realizing it.
- Facility and overhead allocation: Rent and utilities should be allocated per unit based on production volume, using established methods for allocating overhead costs.
If your current model doesn't factor these variables into your bakery profit margins, you are likely pricing your products based on incomplete data.
Case study: Building a dynamic pricing engine in Quadratic
To solve these complexity issues, a growing bakery used Quadratic to build a dynamic financial model. The goal was to track raw materials, logistics, and facility costs simultaneously while differentiating between B2B and B2C sales channels.
Centralized data for ingredients and packaging
The foundation of the model was a "Master Material List." In a traditional spreadsheet, updating the price of flour often requires checking multiple tabs or risking broken formulas. In Quadratic, the user created a central dataset for all ingredients and packaging materials.

This setup ensured that if the price of vanilla extract increased, the user only had to update it in one cell. That single change instantly cascaded through every recipe and product SKU in the system, recalculating the cost of every cookie, cake, and pastry immediately. This eliminates the manual error prone to static spreadsheets and ensures the cost data is always current.
Logic branching for B2B vs. B2C
The most critical part of this workflow was handling tiered pricing, reflecting the inherent differences in B2B and B2C pricing strategies. The bakery sold the same physical product to two different types of customers, which required two different margin calculations.
Using Quadratic, the owner built logic to separate the costs based on the channel:
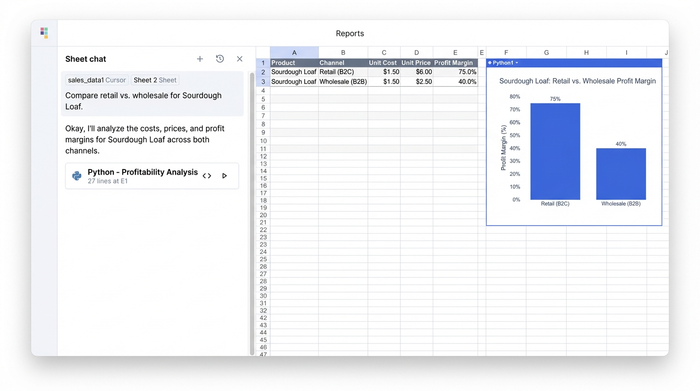
- Retail logic: Calculated the cost of the pastry plus individual packaging (box, sticker) and compared it against the higher retail price.
- Wholesale logic: Calculated the cost of the pastry plus bulk packaging (crate allocation) and logistics fees, comparing it against the lower wholesale price.
This allowed the user to see two distinct profit margins for bakery products side-by-side for a single SKU. They could instantly see that while the chocolate croissant had a healthy margin in the shop, the wholesale price they were offering to cafes was barely breaking even once delivery costs were factored in.
Integrating logistics and production
Finally, the model incorporated production quantities. By inputting the planned bake volume, the model could distribute facility costs more accurately. This helped the owner understand how production volume affects unit cost and thereby impacts the bottom line—baking 500 loaves resulted in a significantly better margin per unit than baking 50, providing data to support bulk production runs.
Analyzing profitability: Unit profit & margin percentages
Once the data is structured dynamically, the focus shifts from data entry to strategic analysis, including detailed product profitability analysis. The bakery owner could now view bakery profit margins on a granular, per-unit basis rather than just looking at a monthly P&L statement.
This level of visibility enables powerful scenario planning. For example, the owner could ask, "What happens to my bread bakery profit margin if grain prices rise by 10% next month?" In Quadratic, they simply adjusted the input variable for grain, and the model instantly highlighted which products would fall below the target profitability threshold.
This data, a result of robust financial data analytics, drives strategic pricing decisions, particularly important when implementing dynamic pricing strategies for perishable goods. If the model reveals that wholesale margins are too thin, the owner has clear options: raise the wholesale price, switch to cheaper bulk packaging, or increase the minimum order quantity to offset logistics costs. Instead of guessing, every decision is backed by hard numbers.
Optimizing for production planning
Beyond pricing, this dynamic model aids in inventory analytics and production planning. Knowing the target margins allows the bakery to plan production runs that maximize efficiency. If the facility overhead per unit drops significantly at a certain volume, the bakery can adjust its schedule to bake in larger batches less frequently, thereby reducing waste and improving the overall margin.

Conclusion: From static sheets to dynamic strategy
Calculating a bakery profit margin is not a one-time math problem; it is an ongoing financial strategy that requires constant adjustment. As ingredient prices fluctuate and sales channels evolve, your financial model must be able to keep up.
The shift from static templates to a dynamic tool like Quadratic allows bakery owners to handle the real-world complexity of their business. By centralizing data and accounting for the nuances of wholesale and retail costs, you stop guessing at your expenses and start building a strategy that ensures long-term profitability.
Try Quadratic, the AI spreadsheet that does your work for you
Use Quadratic to maximize bakery profit margin
- Centralize all ingredient and packaging costs in one place, so a single price update instantly recalculates costs across every product and recipe.
- Build dynamic models that separate wholesale (B2B) and retail (B2C) logic, allowing you to see distinct profit margins for the same product based on the sales channel.
- Integrate hidden costs like packaging variance, logistics, and facility overhead directly into your unit cost calculations for accurate pricing.
- Analyze profitability per unit and conduct scenario planning to understand how ingredient price changes or production volumes impact your bottom line.
- Make data-backed decisions on pricing, production planning, and order quantities instead of relying on industry averages or incomplete data.
Ready to get a clear picture of your bakery's finances? Try Quadratic.