
Table of contents
Creating a 5-year strategic plan is rarely as simple as dragging a growth percentage across a spreadsheet. For financial planners and founders preparing for Series A or B funding, the reality of business growth is messy. You are modeling complex operational realities, such as launching a phased market expansion, introducing new product lines, and managing variable unit economics.
Standard spreadsheets and static P&L forecast templates often fail to capture this complexity. When you attempt to model a "phased rollout"—where Market A starts in January and Market B launches in June—hard-coded cells become a liability. A single change to a launch date can force you to manually audit and adjust dozens of columns, increasing the risk of broken formulas and eroded investor confidence.
To build a roadmap that withstands due diligence, you need a driver-based p&l forecast model. By moving beyond rigid templates and utilizing the dynamic capabilities of Quadratic—where Python and SQL run alongside your data—you can build a 5-year plan that adapts instantly to strategic pivots.
Why static P&L forecast templates fail for growth
When you search for a p&l forecast template, you usually find a static .xlsx file designed for a single, linear timeline. These templates work well for simple, steady-state businesses. However, they crumble when applied to high-growth startups or organizations planning multi-region expansion.
The core issue is the lack of separation between data and logic. In a standard template, the "start date" of a new market is often implied by where you begin typing numbers in the grid. If your strategy shifts and the launch of the "UK Region" moves from Q1 to Q3, you cannot simply update a date field. You must manually cut and paste revenue and expense projections six columns to the right. This manual restructuring is prone to error and makes scenario planning—a critical part of fp&a modeling—incredibly tedious.
Effective forecasting requires a system where logic dictates the output. You need a model that understands conditional statements, such as "If the current date is past the Launch Date variable, then begin calculating Revenue." This approach allows you to change a single input and watch the entire 5-year forecast align automatically.
The anatomy of a dynamic P&L model
A robust p and l forecast is built on a modular architecture. Rather than a wall of numbers, your model should consist of distinct, interacting components. This structure ensures that when assumptions change, the integrity of the model remains intact.
Global assumptions (the driver menu)
This is the control center of your forecast p&l. Here, you define the variables that drive the business, such as customer acquisition costs (CAC), churn rates, pricing tiers, and critical timeline dates. In Quadratic, you can define these as Python variables, keeping them separate from the grid to prevent accidental overwrites.
Revenue engine
Revenue should never be a hard-coded line item; for a robust product profitability analysis, it is a calculation derived from your unit economics and revenue drivers. In a dynamic model, the revenue engine looks at your global assumptions—specifically the launch dates and growth rates—to generate the top-line numbers for each region.
Opex and COGS
Your costs must scale intelligently, requiring strategic labor cost planning for financial sustainability. While rent might be a step-function cost (increasing only when headcount breaches a certain threshold), server costs or inventory might scale linearly with user growth.
Whether you are modeling a seed-stage SaaS company with a complex financial model for saas startup or conducting a complex Natural Resource Partners L.P. forecast and analysis, the architectural principle remains the same: the integrity of your financial narrative relies on isolating your inputs from your calculations. This separation allows you to explain exactly how a specific assumption impacts the bottom line.
Step-by-step: how to do a P&L forecast with staggered markets
Building a forecast that handles staggered market entries requires a workflow that goes beyond basic cell formulas. By using Quadratic, you can leverage Python to handle the logic of time and cohorts, while keeping the output visible in a familiar spreadsheet grid. Here is how to do a p&l forecast that respects phased expansion.
Step 1: Define your drivers using Python variables
Instead of burying your assumptions in cell B2 or C5, use Python to set clear, named variables. In Quadratic, you can write a script to define your launch dates and growth parameters.
market_us_launch = "2024-01-01"

market_uk_launch = "2025-06-01"

market_jp_launch = "2026-01-01"

growth_rate_monthly = 0.05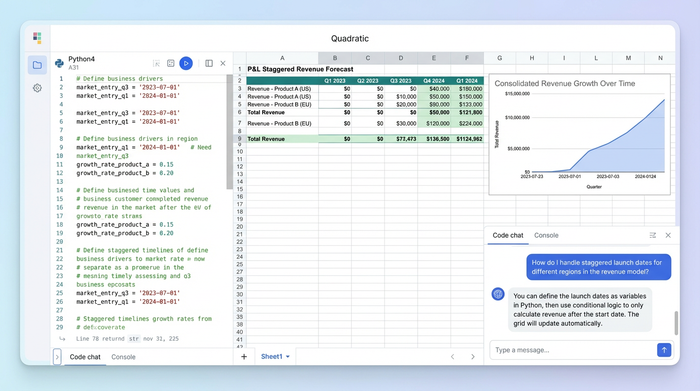
By naming these variables, you make the model self-documenting. Anyone reviewing the sheet can read the code and understand the strategic intent immediately.
Step 2: Build the time-series logic
The most difficult part of learning how to forecast p&l for multiple markets is managing the "active" periods. You can write a Python function that generates the timeline for your 5-year plan. This function checks each month against your launch variables.
If the model reaches June 2025, the script automatically triggers the "UK Market" logic, populating revenue and associated costs. If you later decide to delay the UK launch to December, you simply update the market_uk_launch variable, and the logic automatically shifts the data in the grid.
Step 3: Layering revenue streams
Once the timeline logic is in place, you can layer your revenue streams. You might have subscription revenue that compounds and one-time implementation fees that occur only at the point of sale. Python allows you to loop through these distinct revenue types and stack them into a consolidated view, ensuring that your cash flow projections reflect the nuance of your business model.
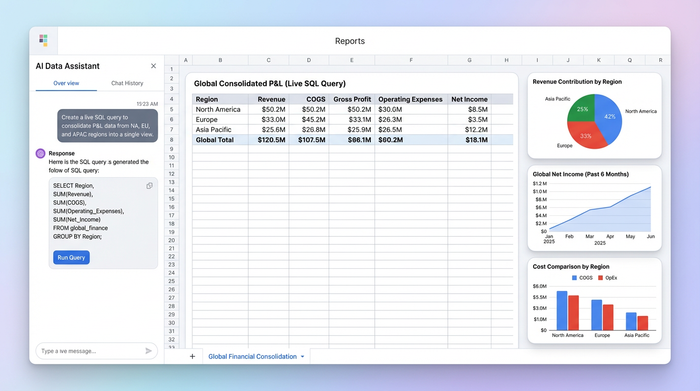
Consolidating data: handling multi-region complexity
A major limitation of a standard forecast p&l template is financial consolidation. When you are managing separate P&Ls for the US, UK, and Japan, the traditional workflow involves creating three separate tabs and a fourth "Summary" tab linked by fragile formulas. Alternatively, finance teams often export data to external BI tools like Power BI just to see the total picture, which disconnects the reporting from the modeling.
Quadratic solves this by allowing you to query your data directly within the spreadsheet using SQL. You can treat your different regional sheets as tables in a database.
By writing a simple SQL query, you can pull the Net Income rows from the US, UK, and Japan sheets and sum them into a "Global Consolidated P&L." This connection is live. If you adjust the hiring plan in the UK sheet, the Global P&L updates instantly. You no longer need to check if your sum formulas span the correct range; the query handles the aggregation dynamically.
Stress-testing and investor readiness
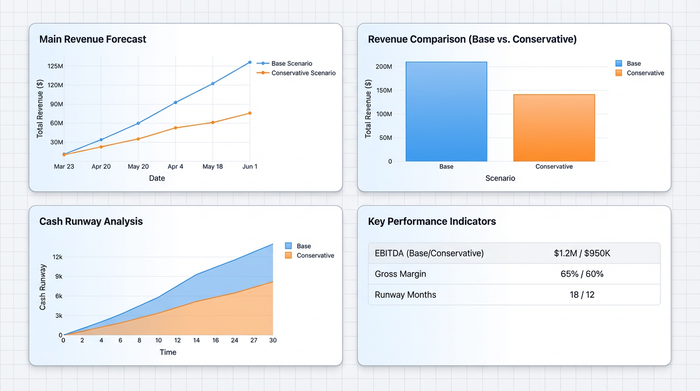
Investors expect you to defend your numbers. They are rarely interested in just the "Base Case"; they want to see the "Downside Case" and understand how resilient the business is to shocks.
In a static p&l forecast, creating a downside scenario often means saving a file as Financial_Model_v2_Downside.xlsx. This creates version control chaos. In a driver-based Quadratic model, you can create a "Scenario Toggle."
You can script a dropdown menu that switches between "Aggressive," "Base," and "Conservative." When you switch to "Conservative," your Python logic can automatically reduce growth rates by 20% and delay launch dates by six months. The entire 5-year plan recalculates in seconds. This capability allows you to visualize the "Hockey Stick" growth curve while demonstrating to investors that you have rigorously stress-tested the underlying assumptions.
Conclusion
A 5-year strategic plan is a living document, not a static artifact to be filed away after a board meeting. As your company grows and market conditions shift, your model must be able to absorb new realities without breaking.
To accurately forecast p&l for a scaling, multi-market organization, you need tools that prioritize logic and flexibility over rigid grid math. By moving beyond standard Excel templates and building your financial core in Quadratic, you gain the power of Python and SQL to handle phased rollouts, real-time consolidation, and instant scenario planning.
If you are ready to build a strategic plan that actually works the way your business does, try building your next model in Quadratic.
Use Quadratic to do p&l forecast for phased expansion
- Build dynamic 5-year P&L forecasts that adapt instantly to strategic pivots and market shifts.
- Define launch dates, growth rates, and unit economics as Python variables, eliminating fragile, hard-coded cells.
- Automate phased market rollouts and new product launches, ensuring all revenue and costs recalculate instantly with a single date change.
- Consolidate multi-region P&Ls in real-time using SQL, treating regional sheets as live database tables.
- Create instant scenario analyses (e.g., base, aggressive, conservative) by toggling Python-driven assumptions, stress-testing your plan in seconds for investor readiness.
Ready to build a strategic plan that works as dynamically as your business? Try Quadratic.