
Closing the books for individual entities is often the easy part of the month-end process, but the real headache begins with financial close and reporting challenges when you attempt to consolidate those entities and realize the numbers simply don’t add up. One subsidiary records a receivable, but the counterparty hasn’t booked the payable. Or perhaps the transaction dates slipped across the month-end cut-off, leaving your consolidated view full of noise.
As entity counts grow and transaction volumes increase, the manual effort required to reconcile intercompany transactions in standard spreadsheets breaks down, leading to a significant cost of manual errors. Version control issues arise, formulas break under heavy row counts, and finance teams spend days ticking and tying rows instead of analyzing the results.
This article outlines a connected workflow that moves beyond manual checking. We will explore how to reconcile intercompany transactions using a data-connected canvas like Quadratic. By ingesting raw data directly from source systems, you can automate the detection of errors and spot mismatches instantly.
Why intercompany transactions break (the root causes)
Before you can fix the data, you must understand why it breaks. Most reconciliation issues aren't random; they fall into specific categories of operational drift. Standard spreadsheets struggle to spot these because they lack "relational" awareness—they see cells, not relationships between datasets.
To effectively clean up the consolidation process, you need to identify the three primary culprits:
- Timing differences: One entity books a receivable in March, while the counterparty records the payable in April. The transaction is valid, but the period misalignment causes an imbalance in the consolidated report.
- Currency and FX rate variances: When entities operate in different functional currencies, FX rate variances often fluctuate between the invoice date and the recording date.
- Missing counterpart postings: Entity A charges Entity B for shared services, but Entity B never records the transaction in their ledger. These "orphan" transactions are often the hardest to find in a manual review.
How to reconcile intercompany transactions: a modern workflow
The goal of a modern reconciliation process is to stop hunting for needles in haystacks and start building a magnet. Instead of manually comparing rows, you can build a system that highlights exceptions automatically. Here is how to reconcile intercompany transactions using a programmable data canvas.
1. Centralize data from multiple source systems
The traditional approach involves downloading CSV files from different bank portals or ERP modules and pasting them into separate tabs of a spreadsheet. This is static, prone to copy-paste errors, and instantly outdated.
In a modern workflow using Quadratic, you skip the manual export. You import live data—including invoices, journal entries, and bank transfers—directly from the different entity ledgers into the canvas. Because Quadratic connects to sources like Postgres, Snowflake, or other databases, the data remains raw and unedited. This preserves the "source of truth" and ensures you are always working with the most current numbers.
2. Align by intercompany ID and period
Once the data is in the same environment, the next step is alignment. In a standard spreadsheet, this usually involves fragile lookup formulas. In Quadratic, you can use SQL or Python directly within the grid to join these disparate datasets.
The most effective method is to match transaction IDs across the datasets. You can write a query to filter data specifically by accounting period (e.g., "Q3 Consolidation") and join the tables based on the unique intercompany reference codes. This isolates the relevant transactions from millions of rows of historical data, creating a clean workspace for the current month’s close.
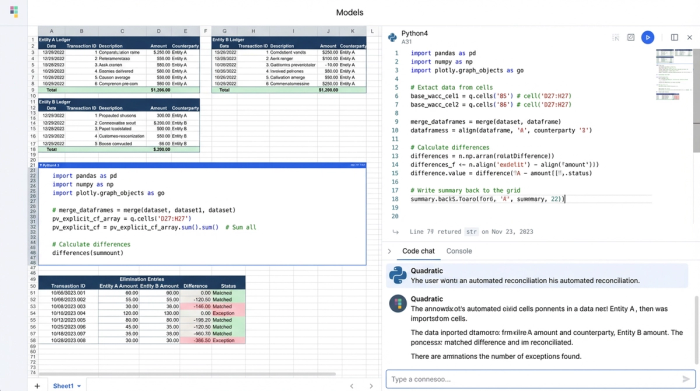
3. Calculate elimination entries
With the transactions aligned, the system can identify perfect matches. When Entity A’s receivable matches Entity B’s payable exactly, they offset each other.
You can write a simple function to net these out. These are your elimination entries, the adjustments required to remove internal transactions from the final consolidated financial statements. By automating the identification of these perfect matches, you clear 90% of the noise from your view, leaving you to focus solely on the exceptions.
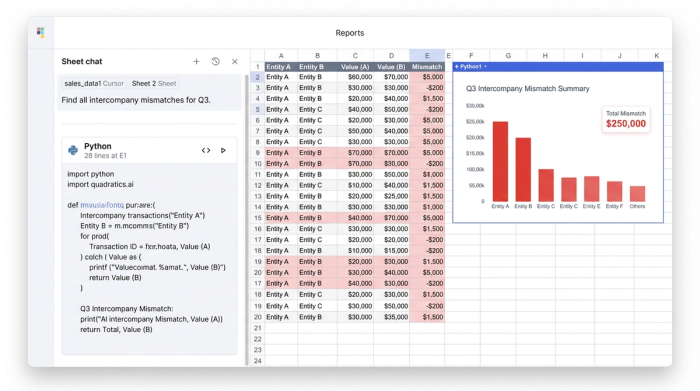
Building the intercompany mismatch report
The true value of this workflow isn't just seeing what matches; it is seeing what doesn't. This is where you build your custom intercompany mismatch report. Unlike a static spreadsheet that just lists rows, this report is a dynamic query that specifically targets errors.
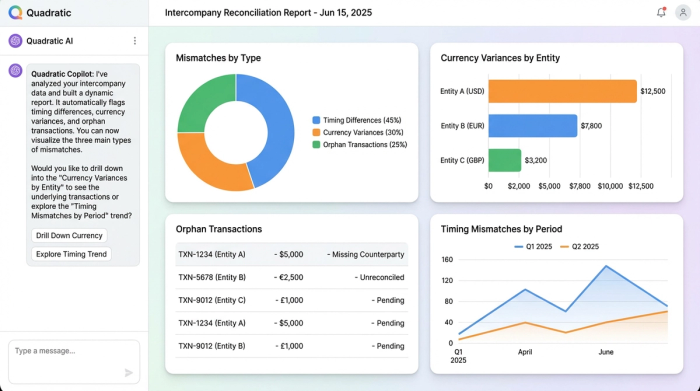
To build this report, you structure your logic to flag specific conditions:
- Flagging timing differences: You can query for transactions that share a matching ID but have different dates or fall into different accounting periods. The report highlights these rows, allowing you to quickly post an accrual to align the periods.
- Highlighting currency variances: By calculating the delta between the recorded amount and the settled amount, you can instantly spot discrepancies caused by FX shifts. This allows you to separate true errors from simple exchange rate fluctuations.
- Identifying orphans: The report filters for transactions that have no matching counterpart ID. These missing counterpart postings are immediately flagged for investigation, telling you exactly which entity needs to book a missing entry.
The result is a dynamic dashboard that lists exactly which transactions require manual intervention, saving hours of hunting through ledgers.
The "middle ground": why flexibility matters in reconciliation
Finance teams often feel stuck between two extremes. On one side, enterprise resource planning (ERP) systems offer robust reconciliation modules, but they are rigid "black boxes." If your company has a unique transfer pricing model or a complex entity structure, modifying the ERP logic is expensive, slow, and often requires IT support.
On the other side, standard spreadsheets offer flexibility but break under heavy data loads. They cannot effectively query millions of rows or handle complex logic without crashing.
Quadratic offers a necessary middle ground. It provides the data power of an ERP—handling large datasets and allowing for SQL queries—with the flexibility of a spreadsheet. You can tweak the logic of your mismatch report on the fly, adjust for new subsidiaries, or change your currency conversion rules using Python or formulas. It allows operations managers to build the exact tool they need without waiting for a software implementation team.
Conclusion
Reconciling intercompany transactions does not have to be a manual nightmare or require a six-figure software investment. By moving away from static CSVs and adopting a connected, data-driven workflow, you can turn a multi-day struggle into a streamlined process.
Ingesting raw data and building a custom mismatch report allows you to close the month faster and trust your consolidated numbers. Instead of checking every transaction, you only touch the ones that matter.
Try Quadratic, the AI spreadsheet that does your work for you.
Use Quadratic to reconcile intercompany transactions
- Streamline data ingestion: Connect directly to source systems to import live intercompany transactions, eliminating manual CSV exports and ensuring you always work with the most current data.
- Automate mismatch detection: Use SQL or Python directly in the grid to instantly align transactions by ID and period, flagging timing differences, FX variances, and missing counterpart postings.
- Accelerate elimination entries: Automatically net out perfect intercompany matches, clearing the majority of transactions so your team can focus only on critical exceptions.
- Build flexible, dynamic mismatch reports: Customize reconciliation logic to adapt to unique entity structures and currency rules, providing a dynamic dashboard of only the transactions requiring intervention.
Ready to simplify your intercompany reconciliation process? Try Quadratic.