Table of contents
Subscription creep is the financial equivalent of death by a thousand cuts. It usually starts with a free trial you forgot to cancel, followed by a streaming service you haven’t watched in months, and finished off by a silent price hike on a software license you use daily. Before long, these small, recurring charges inflate your monthly burn rate, often without you noticing until you check your bank statement.
For most people, the solution to this problem falls into two extremes. On one side, there are dedicated subscription tracking tools like Rocket Money or features built into banking apps. While convenient, they often come with monthly fees of their own, privacy concerns regarding how your data is used, or rigid dashboards that group categories in ways that don’t match your mental model. On the other side is the manual subscription tracking spreadsheet. This offers total control but requires the tedious drudgery of downloading CSVs, formatting columns, and manually entering transaction dates every month.
There is, however, a middle way. By using Quadratic to connect live financial data via Plaid directly into a spreadsheet environment, you can build a dynamic subscription tracking tool. This approach combines the automation of a paid app with the flexibility and privacy of a spreadsheet, giving you a customized system to normalize messy bank data, detect price hikes, and regain control over your recurring charges.
Why build your own subscription tracking software?
When looking for the best tools to track monthly subscriptions, most people assume they need to download a dedicated mobile app. However, for "prosumers" and finance enthusiasts who want granular control over their data, a pre-packaged app is often too limiting. This is where personal finance templates can offer a more customized solution.
Building your own workflow in Quadratic bridges the gap between consumer convenience and enterprise-grade data control. First, there is the issue of privacy. When you build your own tool, you are the owner of the data, not the product being sold to advertisers. Second, you gain unlimited customization. Most apps force you into their categorization logic—grouping software with entertainment or utilities with services. In your own tool, you define the hierarchy.
Finally, there is the cost efficiency. It is counterintuitive to pay a monthly subscription fee just to monitor your other monthly subscriptions. By creating your own subscription tracking software within a flexible spreadsheet environment, you eliminate the middleman and the recurring cost, relying instead on your own logic to manage your finances.
The workflow: connecting Plaid to Quadratic
The foundation of this tool is spreadsheet automation. In a traditional Excel or Google Sheets workflow, the friction of logging in to five different credit card portals, downloading statements, and pasting rows often leads to abandonment.
In Quadratic, you can bypass this manual entry by connecting your bank accounts directly through the integrated Plaid API. Once connected, your transaction data flows directly into the spreadsheet cells. This connection is live, meaning as transactions clear your bank, they populate in your subscription tracking tool. You no longer need to schedule a "finance night" just to see where your money went; the raw data is always there, waiting for analysis.
Merchant normalization: cleaning up the data
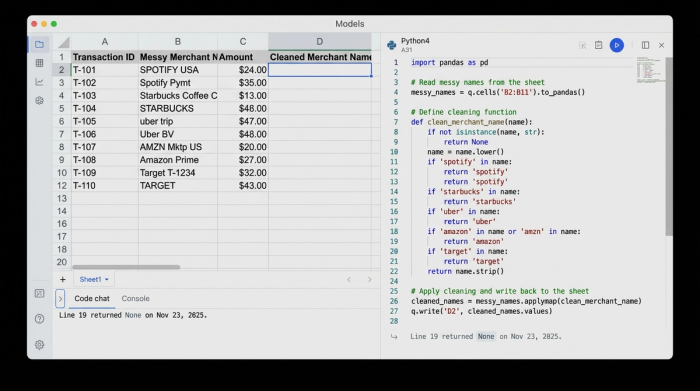
One of the biggest challenges in analyzing bank data is the messy nature of merchant names. A single service like Spotify might appear as "SPOTIFY USA," "Spotify Pymt," or "SPOTIFY*SUBSCRIPTION" depending on the payment method or time period. In a standard spreadsheet, this makes pivot tables and categorization nearly impossible without manual cleanup.
This is where Quadratic’s integration of Python becomes a powerful asset. Instead of manually finding and replacing text, you can write a simple Python script directly in the grid to standardize these names. You can create a mapping dictionary that looks for keywords (like "Netflix" or "Adobe") and outputs a clean, uniform Merchant Name.
This process—often referred to as data normalization in enterprise environments—ensures that when you group your expenses later, every instance of a service is captured under a single header. This transforms raw, chaotic bank strings into a clean dataset ready for accurate reporting.
Detecting "subscription creep" and price hikes
Once your data is live and normalized, the next step is identifying which charges are actually subscriptions. A standard list of transactions doesn't distinguish between a one-time dinner and a recurring software fee.
Using SQL or Python within Quadratic, you can apply methods for identifying recurring transactions in your transaction history. You can script the tool to flag transactions that occur on the same day of the month or year with the same merchant name. This logic automatically isolates recurring charges from one-off spending.
Furthermore, you can build a "Price Alert" system. By comparing the most recent transaction amount against the historical average for that specific merchant, the tool can flag variances. If your Adobe Creative Cloud subscription jumps from $54.99 to $59.99, your script can highlight the cell or move the item to a "Review" list. This replicates the price increase alerts found in paid consumer apps, ensuring you are never caught off guard by a silent rate hike.
Building the "review queue" dashboard
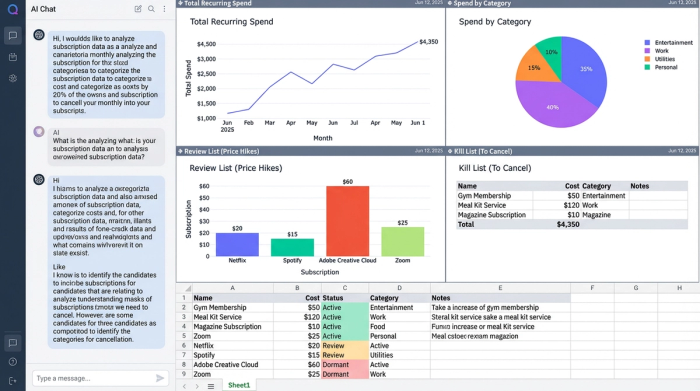
The ultimate goal of a subscription tracking tool is to help you make decisions. To facilitate this, you can build a dashboard view that adheres to effective dashboard design principles and categorizes your recurring charges by status.
- Active: These are approved subscriptions that are consistent in price and frequency.
- Review: These are items where a price change was detected or a new recurring charge appeared for the first time.
- Dormant: By cross-referencing your subscription list with recent transaction dates, you can flag services that you are paying for but haven't seen a recent charge for (or conversely, services you thought you cancelled that are still billing you).
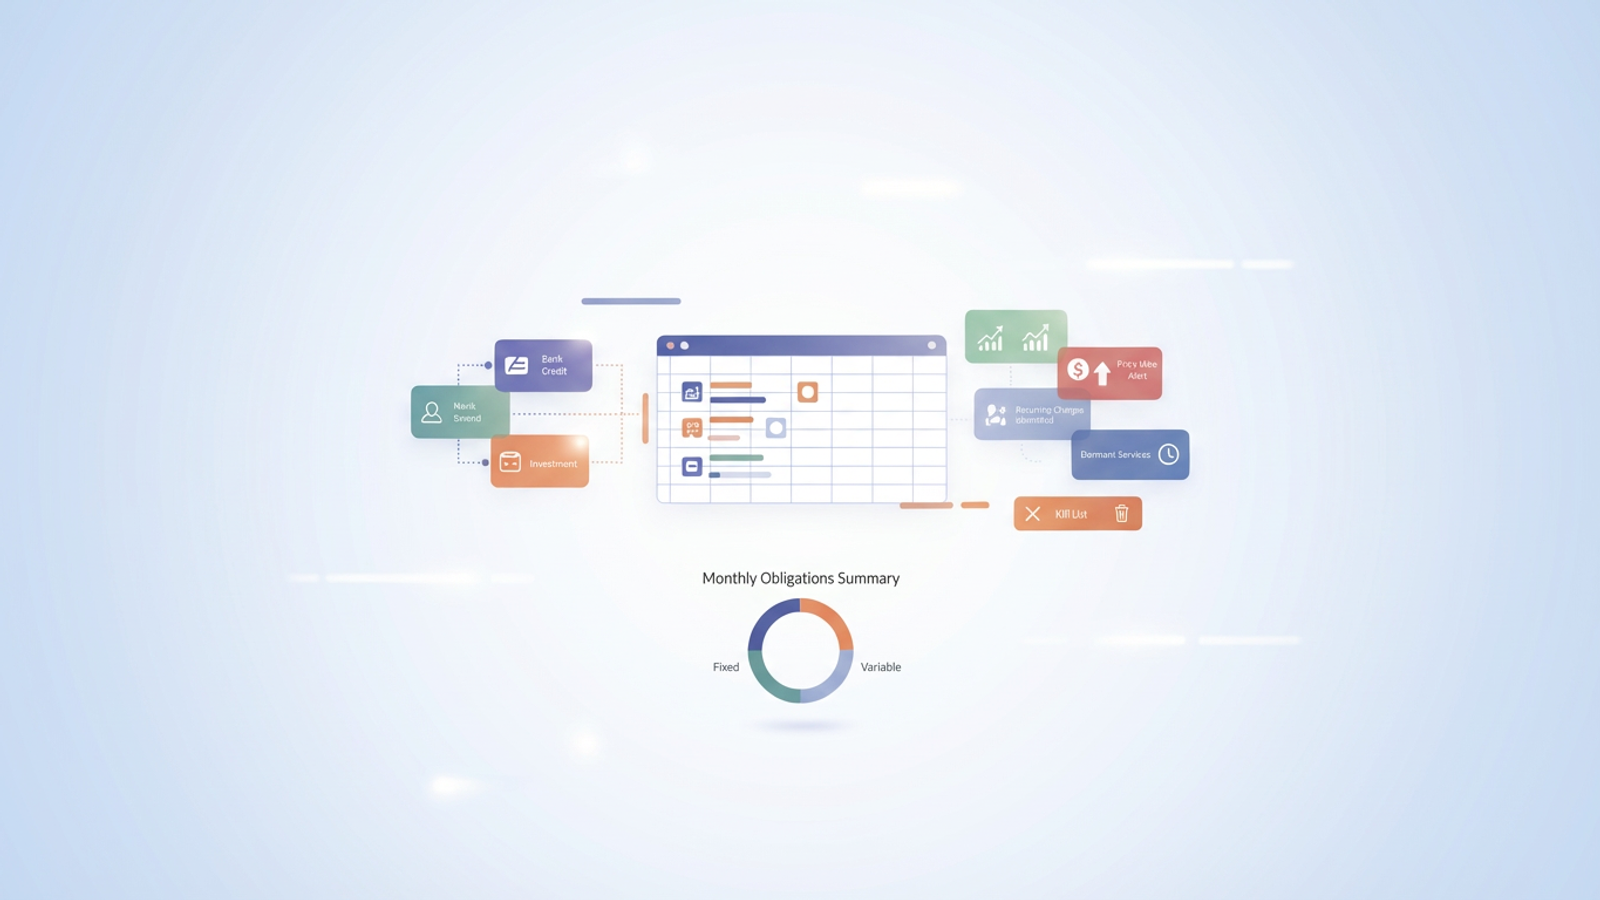
You can even generate a "Kill List"—a specific section of your dashboard that filters for subscriptions you intend to cancel, complete with the URL or phone number required to end the service. This turns your analysis into an actionable to-do list.
Summary of monthly obligations
To wrap up your dashboard, visualize your total financial footprint. Create a summary view that separates "Fixed Monthly Costs" (like rent or insurance) from "Variable Monthly Costs" (like digital subscriptions), effectively building a dynamic accounting spreadsheet for better financial management. This allows for better forecasting than a static snapshot, helping you understand exactly how much money is committed before the month even begins.
Conclusion
You don't need to rely on rigid apps or invasive services to get a handle on your recurring expenses. By leveraging Quadratic, you have built a custom subscription tracking tool that rivals paid software in functionality while offering superior privacy and flexibility. You have automated the data entry via Plaid, cleaned up messy merchant names with Python, and built an alert system for price hikes.
Now that you have the power of an app combined with the adaptability of a subscription tracking spreadsheet, you can stop reacting to your bank statement and start proactively managing your financial life.
Use Quadratic to build a dynamic subscription tracking tool
- Automate data collection: Connect live bank data via Plaid directly into your spreadsheet, eliminating manual downloads and data entry for recurring charges.
- Clean and normalize merchant data: Use Python scripts within the grid to standardize messy bank transaction names (e.g., "SPOTIFY USA" to "Spotify") for accurate categorization.
- Automatically identify recurring charges: Leverage SQL or Python to flag transactions that occur regularly, distinguishing subscriptions from one-time expenses.
- Detect silent price hikes: Build an alert system to compare current subscription costs against historical data, notifying you of any unannounced increases.
- Create custom, actionable dashboards: Design personalized views to categorize subscriptions (Active, Review, Dormant), track cancellation progress, and visualize your total monthly obligations.
- Maintain data privacy and control: Own your financial data in a flexible spreadsheet environment, avoiding the privacy concerns and rigid structures of many dedicated tracking apps.
Ready to take control of your recurring charges? Try Quadratic.