
We have all experienced subscription fatigue. It is that low-level anxiety that comes from knowing your bank account is slowly draining, five and ten dollars at a time, often without you noticing until the monthly statement arrives, a phenomenon exacerbated by the fact that consumers often significantly underestimate their monthly subscription spending. While major expenses like rent or car payments are easy to remember, the modern financial landscape is cluttered with smaller, automatic deductions that can wreak havoc on a household budget if left unsupervised.
To regain control, you need to understand the nature of these expenses. A recurring charge is an automatic payment authorized to be deducted from your account on a repetitive schedule, such as weekly, monthly, or annually. Managing these effectively requires more than just checking your bank balance occasionally; it requires a programmable system that can adapt to variable costs and timing mismatches. Standard budgeting apps often oversimplify this data, while traditional spreadsheets require too much manual upkeep. By using a programmable financial workspace like Quadratic, you can sync real data, automate the tracking process, and turn a list of transactions into a powerful forecasting tool.
What are recurring charges?
What is a recurring charge? Simply put, it is a commitment to pay a merchant automatically at regular intervals. While the definition seems straightforward, the reality of tracking these charges is complicated by the fact that they generally fall into two distinct categories: fixed and variable.
Fixed recurring charges are the predictable backbone of your budget. These include your mortgage, rent, insurance premiums, and flat-rate streaming services like Netflix or Spotify. You know exactly how much they will cost and exactly when they will hit your account.
Variable recurring charges are far more elusive. These are costs that recur on a schedule but fluctuate in price. Common examples include utility bills, credit card minimum payments, and usage-based software subscriptions. Because the amount changes every month, "set it and forget it" budgeting apps often fail to predict the cash flow impact accurately. If you budget $100 for electricity but a heatwave pushes the bill to $180, a static budget breaks. Understanding the difference between these two types is the first step toward building a system that can handle both stability and volatility.
Why traditional tracking methods fail
Most people attempt to solve the subscription problem in one of two ways, both of which have significant flaws. On one side, you have dedicated subscription-tracking apps. These are excellent for identifying forgotten subscriptions so you can cancel them, but they often act as "black boxes." You cannot easily manipulate the data, run your own scenarios, or adjust the logic to fit your specific financial life. You are stuck with their interface and their limited definition of recurring charges tracking.
On the other side, you have the traditional static spreadsheet. A standard Excel or Google Sheets template offers infinite flexibility, but it demands a heavy tax on your time. You have to manually log into your bank, download a CSV, and copy-paste rows of data every single month. This manual friction is the primary reason people stop budgeting; eventually, the effort outweighs the value of manual expense tracking.
Quadratic offers a middle ground for spreadsheet automation by integrating Python and SQL directly into the spreadsheet grid. This allows you to build a workflow that pulls in data automatically—like an app—but retains the infinite customizability of a spreadsheet. Instead of choosing between convenience and control, you get both.
Building a programmable Recurring Charges Spreadsheet
The most effective way to monitor your financial health is to use personal finance templates to build a recurring charges spreadsheet that updates itself. In Quadratic, this moves beyond simple data entry and becomes a programmable workflow.
The first step is syncing transaction data. Instead of typing in purchases one by one, you can use Python within Quadratic to connect to transaction data sources. Whether you are importing a raw CSV file from your bank or connecting to an API, the data populates the grid instantly. This ensures that your view of your finances is based on actual spending history, not just what you remember to write down.
Once the data is in the sheet, the real power lies in pattern detection. Using SQL or Python, you can write logic to scan your transaction history and identify repeat billing. This is where a programmable tool outshines a standard template. For example, a standard spreadsheet might not recognize that "Spotify USA" and "Spotify" are the same vendor. In Quadratic, you can normalize these merchant names to detect the pattern accurately. You can also set logic to flag amount variance. If your internet bill is usually $70 but suddenly spikes to $90, the system can highlight this anomaly automatically, prompting you to investigate a potential price hike or billing error.
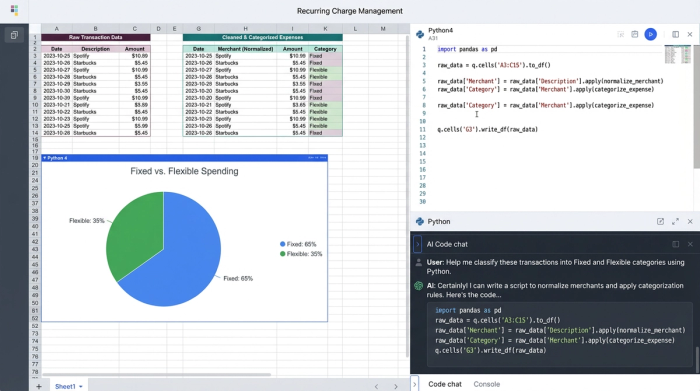
Finally, you can automate categorization. You can tag each recurring charge as "Fixed" or "Flexible." This separation allows you to instantly see how much of your income is locked into essential bills versus lifestyle choices, giving you a clearer picture of where you can cut back if necessary.
Visualizing the cash flow calendar
Knowing how much you owe is important, but knowing when you owe it is critical for cash flow management. A common issue with monitoring recurring charges is that they don't all hit on the first of the month. A large insurance payment hitting two days before payday can cause an overdraft even if you technically have the budget for it.
In a traditional workflow, creating a bill calendar involves manually writing dates into a grid. In Quadratic, you can generate this view programmatically. By using the billing dates identified in your transaction data, you can visualize a calendar that shows exactly when funds will leave your account.
This dynamic visualization helps you spot congestion points. If you see that five different subscriptions renew on the 15th, you might choose to contact a few vendors to change your billing date, smoothing out your cash flow. Because this calendar is generated from live data, it updates automatically as you sync new transactions, ensuring you are never looking at an outdated PDF or a static plan.
The analysis gap: estimating annual costs
The difference between a casual budgeter and a financial analyst is the timeframe. Most people look at monthly costs, thinking, "It's only $15 a month." A robust analysis looks at the annual burden: "That is $180 a year." When you aggregate all your recurring charges, the total annual commitment can be shocking.
Using the financial forecast capabilities in Quadratic, you can calculate the total annual cost of your recurring commitments instantly. This moves the conversation from "Can I afford this coffee?" to "Can I afford this lifestyle?"
Furthermore, having historical data in a programmable environment allows you to track "subscription creep." This is when a service slowly increases its price over time—a dollar here, two dollars there. By visualizing the cost of a specific merchant over a 12-month or 24-month period, you can clearly see the inflation of your fixed costs. This data empowers you to negotiate better rates with providers or switch services entirely, ensuring your budget remains efficient.
From monitoring to saving
Mastering recurring charges is not about depriving yourself of services you enjoy; it is about ensuring that every dollar leaving your account is intentional. A static list of bills is helpful, but a dynamic, programmable system is transformative.
By moving your financial workflow into Quadratic, you eliminate the manual drudgery of data entry and gain the analytical power usually reserved for enterprise finance teams. You can sync your data, detect hidden price hikes, visualize your cash flow, and forecast your annual spending with precision. When you stop worrying about the mechanics of tracking, you can focus on the strategy of saving, building a budget that actually adapts to your life.
Use Quadratic to Master Recurring Charges
- Automate data syncing from bank accounts and APIs to instantly capture all recurring charges in one place.
- Programmatically identify and categorize both fixed and variable recurring charges, adapting to fluctuating costs like utility bills.
- Automatically flag anomalies such as unexpected price hikes or billing errors by detecting unusual changes in charge amounts.
- Visualize your cash flow calendar dynamically to see exactly when payments are due, helping you avoid overdrafts and smooth out expenses.
- Instantly calculate total annual costs and track "subscription creep" over time, empowering you to identify savings and negotiate better rates.
- Combine the flexibility of a spreadsheet with the power of automation, eliminating manual data entry while retaining full control over your financial analysis.
Ready to take control of your spending? Try Quadratic