For many operations directors and financial controllers, the end of the fiscal year triggers a familiar panic. The hunt begins for invoices buried in email threads, delivery receipts saved in random folders, and approval memos that seem to have vanished. This chaotic process is usually in service of the capital expense report—a critical document that validates the company's asset base and depreciation schedules.
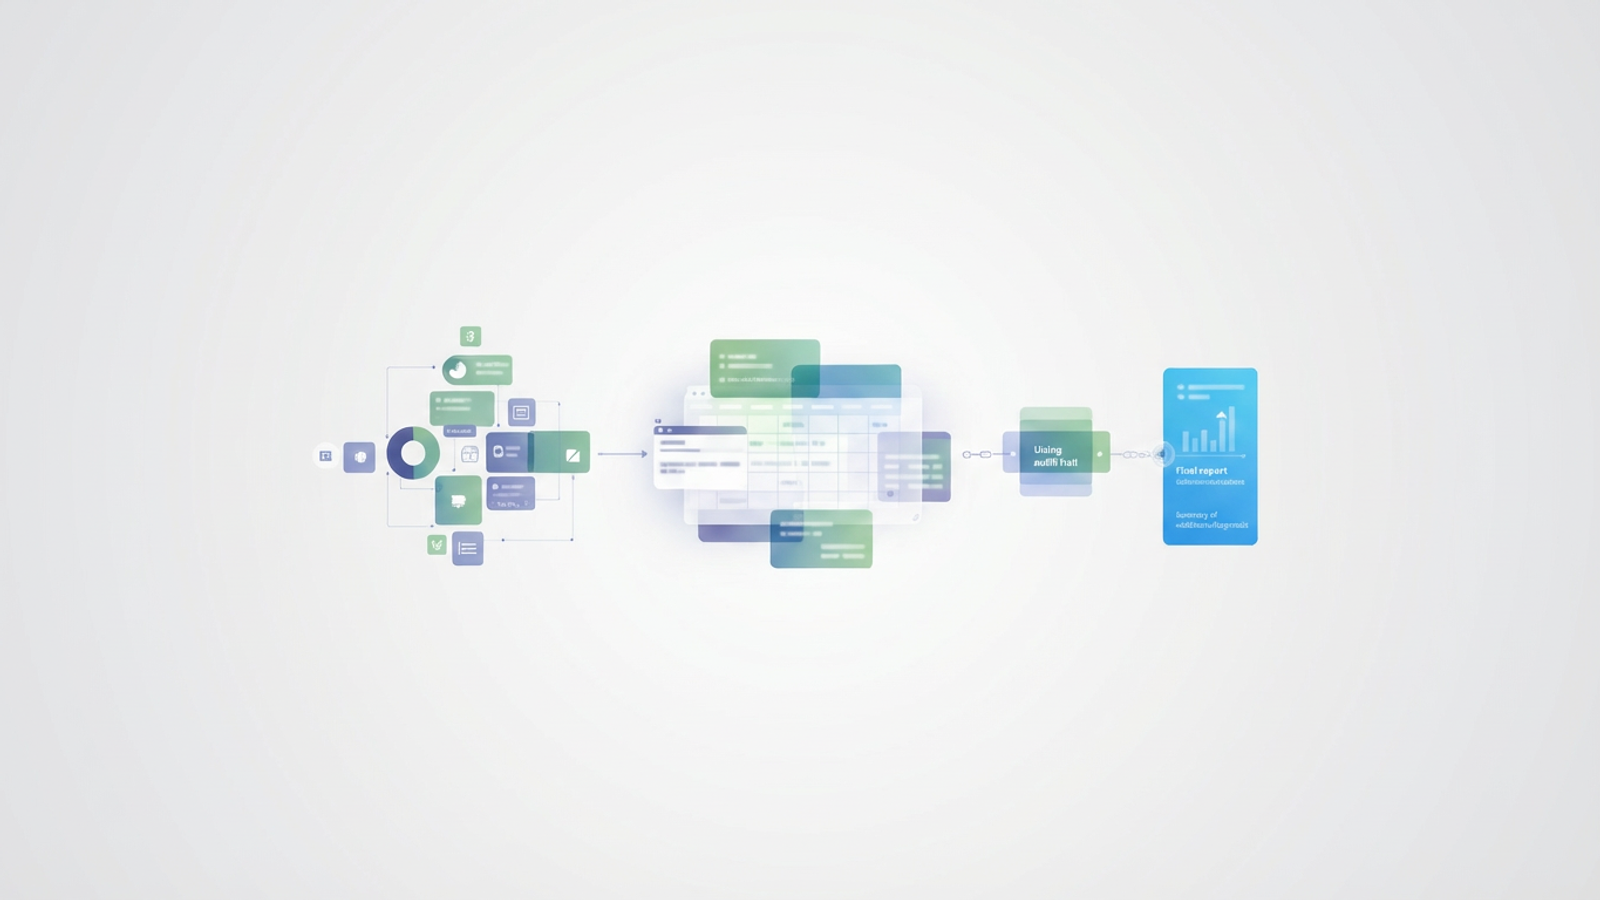
The problem with most capital expense reports is that they are treated as static snapshots. They are often built in rigid spreadsheet templates where data is manually keyed in, disconnected from the original source of spend. This isolation leads to version control issues, calculation errors, and a lack of a clear audit trail. A modern capital expense report should be more than a list of purchases; it should be a connected workflow that bridges the gap between the initial invoice and the final financial statement, especially when supported by a QuickBooks spreadsheet sync. By moving from static templates to a dynamic data environment like Quadratic, finance teams can automate capitalization thresholds, calculate accurate depreciation, and embed audit proof directly alongside the data.
What goes into a robust capital expense report?
Before diving into the workflow, it is important to distinguish between standard operating expenses (OpEx) and capital expenditures (CapEx). While OpEx covers day-to-day running costs like rent and utilities, CapEx refers to funds used to acquire physical assets such as property, buildings, or equipment. These assets provide value over a period longer than one tax year, meaning their cost must be capitalized and depreciated over their useful life rather than deducted fully in the year of purchase.
A comprehensive report tracks the entire lifecycle of these assets. At a minimum, it must include the asset ID, a detailed description, the date placed in service, the cost basis, the estimated useful life, and the depreciation method (such as straight-line or double-declining balance). However, the real challenge begins after the purchase. The report must account for the asset's degrading value over time, requiring continuous updates. This is why static spreadsheets often fail; they struggle to handle the post-spend reality where an asset's book value changes month over month.
The workflow: from invoice to audit-ready report
The most effective way to manage capital expenditures is to treat the report as a living database rather than a flat file. By using Quadratic, an operations director can build a system that ingests raw data, applies logic automatically, and prepares for audits without manual intervention.
1. Centralizing data: importing vendor invoices
In a traditional workflow, an accountant might print a stack of invoices and manually type the details into a spreadsheet. This is slow and prone to human error. A better approach is to import the data directly from the source.
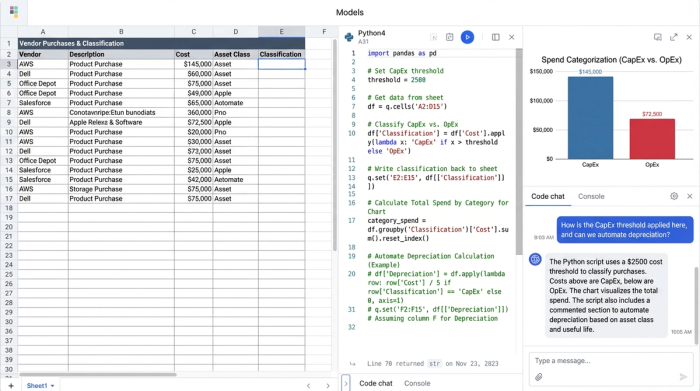
Because Quadratic allows users to connect to data sources or drag and drop CSV files directly into the canvas, you can pull a raw export of vendor transactions—for example, a quarterly download from a hardware supplier like Dell or a furniture vendor. Instead of typing, you simply import the dataset. This ensures that the cost basis in your report matches the invoice exactly, eliminating transcription errors and providing a single source of truth for all potential asset additions.
2. Automating capitalization thresholds & depreciation
Once the raw data is in the system, the next step is determining which items legally qualify as capital assets. Most companies have a capitalization threshold—for instance, a policy stating that only individual items costing more than $2,500 should be capitalized.
In a manual process, a human must review every line item. In a programmable canvas, you can write formulas or use Python scripts to automate this flag. You can set logic that scans the "Unit Cost" column and automatically marks items as "CapEx" or "OpEx" based on the threshold. Furthermore, you can automate the depreciation schedule. By mapping asset classes to their useful life (e.g., computers = 5 years, furniture = 7 years), the sheet can calculate the monthly depreciation expense and current net book value instantly. This transforms raw spend data into a compliant financial schedule without manual calculation.
3. Creating a "living" audit trail
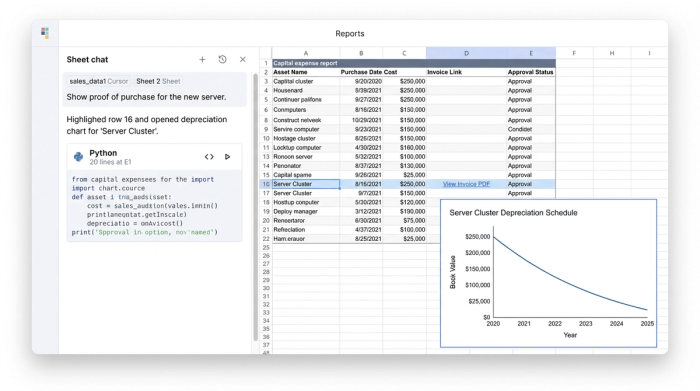
The most stressful part of asset management is the audit. Auditors will select a random sample of high-value assets and ask for proof of purchase and approval. In a standard file system, this requires digging through filing cabinets or searching shared drives for a PDF saved months ago.
Quadratic solves this by allowing you to link documentation directly to the data. You can upload the PDF invoice, the email approval, or the installation receipt and associate it with the specific cell containing the asset's cost. This creates a self-validating report. When an auditor asks, "Where is the documentation for this $10,000 server?" you do not need to leave the report. You simply click the cell, and the proof is there. This capability turns the capital expense report from a liability into an organized, audit-ready asset.
Summarizing the data: additions, disposals, and reporting
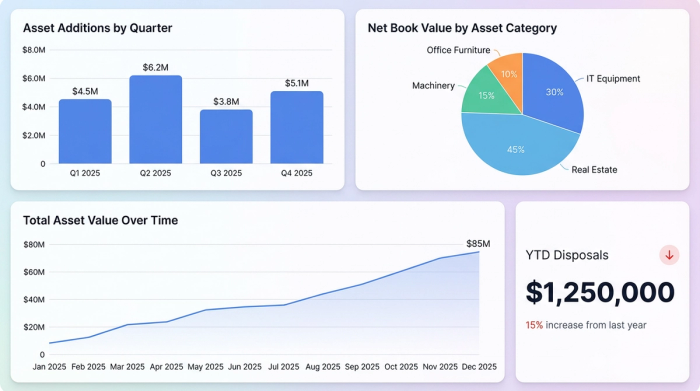
The final piece of the puzzle is reporting to leadership. The CFO and tax team need a high-level summary of the company's position. They need to know the total value of Additions (new assets purchased this year), Disposals (assets sold or retired), and the ending Net Book Value.
Because the underlying data in Quadratic is structured and connected, generating these summaries requires no manual aggregation. You can use pivot tables or SQL queries within the spreadsheet to instantly group assets by category or location. If you dispose of an asset, you simply mark it as "Retired" in the main data set, and the summary report updates automatically to reflect the write-off. This ensures that internal budgets and tax filings are based on real-time data, reducing the risk of overpaying taxes on assets the company no longer owns.
Conclusion: move beyond static templates
A capital expense report is more than a compliance requirement; it is a financial map of the company’s infrastructure. Relying on disconnected spreadsheets and manual data entry exposes the organization to compliance risks and wastes valuable time during audit season.
By moving this workflow into a connected environment like Quadratic, finance leaders can bridge the gap between spend and strategy. You can import data directly from vendors, automate complex depreciation logic, and keep every receipt and approval attached to the relevant line item. This approach turns a tedious administrative task into a streamlined, transparent process. If you are ready to stop chasing invoices and start trusting your numbers, try Quadratic to build a capital expense report that works as hard as your team does.
Use Quadratic to build and manage your capital expense report
- Centralize all capital asset data: Import vendor invoices and transaction data directly, eliminating manual entry errors and creating a single, reliable source of truth.
- Automate capitalization and depreciation: Instantly apply capitalization thresholds and calculate accurate depreciation schedules for assets using formulas or Python scripts.
- Embed an audit-ready trail: Link invoices, approvals, and receipts directly to specific data points, providing instant verification for auditors without leaving your report.
- Generate real-time financial summaries: Automatically aggregate additions, disposals, and net book value for accurate, up-to-date reporting to leadership and tax teams.
Ready to streamline your asset tracking and audit preparation? Try Quadratic.