
Table of contents
- Why static calculators and spreadsheets fail
- The "magic number" vs. real data
- Building a dynamic Emergency Fund Tracker in Quadratic
- Interpreting your financial runway
- Advantages over a standard Emergency Fund Spreadsheet
- When to adjust your target
- Conclusion: move from guessing to knowing
- Use Quadratic to track your emergency fund
The most stressful question in personal finance is often the simplest: "If I lost my job today, how long could I last?" The anxiety surrounding this question, underscored by recent US household emergency savings statistics, drives millions of people to save, scrimp, and worry. The standard financial advice is well-known: you should save three to six months of expenses. While this rule of thumb provides a general target, it relies on a dangerous assumption—that you actually know what your monthly expenses are.
Most people trying to answer this question rely on a static number. They guess their monthly burn rate, multiply it by six, and set a savings goal. However, life is rarely static. Inflation, lifestyle creep, and irregular bills mean that the "safe" number you calculated last year might leave you underfunded today. To get a true answer, you need more than a static goal; you need a dynamic Emergency Fund Tracker. By moving beyond manual calculations and building an automated budget in Quadratic that connects to your actual banking data, you can stop guessing your runway and start tracking it in real-time.
Why static calculators and spreadsheets fail
The traditional approach to tracking financial safety involves downloading a template or building a simple accounting spreadsheet, often relying on static budget limitations. These tools usually require you to manually input a single cell labeled "Monthly Expenses." You might look at your credit card bill from last month, estimate $3,000, and type it in. The spreadsheet then tells you that to be safe for six months, you need $18,000.
The flaw in this "set it and forget it" method is the reality of spending. A spreadsheet created in January captures your financial life at a single moment in time. By June, your rent may have increased, your grocery bill may have gone up, or you may have taken on a new subscription. If your expenses creep up to $3,500 but your tracker still says $3,000, you are operating under a dangerous illusion of safety. You might believe you have six months of coverage when, in reality, you only have five.
The "magic number" vs. real data
When people search for financial safety advice, they often look for a "magic number." They want to be told that $20,000 is the finish line. However, financial resilience is not defined by a dollar amount in a savings account; it is defined by the relationship between your liquid assets and your burn rate.
You do not need a magic number. You need a living metric based on your actual transaction data. A savings account with $50,000 is incredibly secure for someone spending $4,000 a month, but it is precarious for someone spending $12,000 a month. Because your spending habits fluctuate, your safety metric must be dynamic.
Building a dynamic Emergency Fund Tracker in Quadratic
Quadratic allows you to bridge the gap between simple expense tracking and calculating true financial safety. By using a modern, AI-powered spreadsheet that supports Python and SQL, you can build a workflow that updates itself. Here is how a household can set up a dynamic tracker to monitor their financial runway.
1. Syncing your balances (assets)
The first step in building your tracker is establishing how much cash you actually have. In a traditional workflow, this involves logging into your checking account, your high-yield savings account, and perhaps a brokerage account, then manually summing the totals.
In Quadratic, you can pull in live data from your financial sources. Whether you are using an API to fetch bank balances or connecting to a database where you aggregate your transaction data, you can automate the "Assets" side of the equation. This ensures that every time you open your tracker, the "Cash on Hand" number reflects reality, not what you had in the bank two weeks ago.
2. Calculating your true "burn rate" (liabilities)
This is where the Quadratic workflow distinguishes itself from a basic calculator. To understand your runway, you must differentiate between "essential" and "discretionary" spending, a principle often used in a 50 30 20 budget calculator.
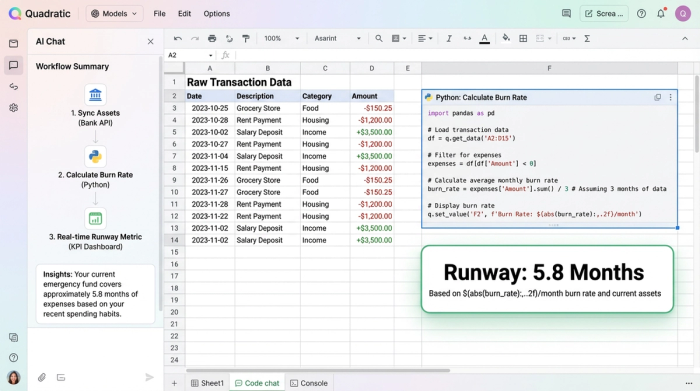
Using Python directly within the Quadratic grid, you can analyze your historical transaction data. You can write a script to average your last 12 months of spending while performing a category spend analysis, filtering out categories tagged as "vacation," "dining out," or "entertainment." This calculation provides you with a "Bare Bones" monthly expense number—the true cost of survival required to keep the lights on and food on the table—rather than just an average of all outflows.
3. The formula: cash / burn rate = runway
Once you have automated your live cash balance and your calculated essential burn rate, the final step is the runway formula. You simply divide your total available cash by your monthly burn rate.
The result is not a dollar sign; it is a time metric. Your Emergency Fund Savings Tracker will display exactly how many months of coverage you currently have. If you spend less next month, your burn rate drops, and your runway automatically extends. If you spend more, your runway shortens. This immediate feedback loop connects your daily spending habits directly to your long-term security.
Interpreting your financial runway
Once your data is live, you can create different scenarios to better understand your position.
Scenario A: The "Bare Bones" Runway
This metric answers the survival question: "If I cut all fun spending, how long can I survive?" This is your true emergency baseline.
Scenario B: The "Comfortable" Runway
You can also run a secondary calculation that includes your discretionary spending. This tells you how long you can maintain your current lifestyle without income.
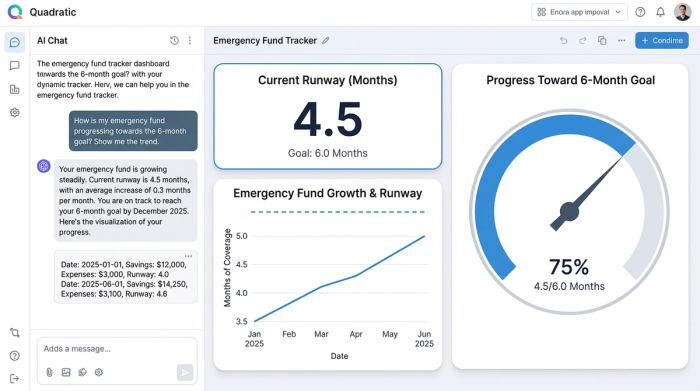
Because this is a living calculator, these numbers update every time you open Quadratic. You might log in on a Friday and see that you have 5.2 months of comfortable runway. If you transfer a bonus into your savings account on Monday, that number might jump to 6.1 months immediately.
Advantages over a standard Emergency Fund Spreadsheet
The primary advantage of using Quadratic over a standard Emergency Fund Spreadsheet is spreadsheet automation. The friction of manual data entry is the main reason people stop tracking their finances. When the data flows in automatically, the tracker remains useful even during busy periods of life.
Accuracy is the second major benefit. We are often optimistic about our spending when we guess. We tend to round down our grocery bills and forget about annual subscriptions. By using averages from actual historical data, your tracker removes human bias.
Finally, financial data visualization plays a key role. In Quadratic, you can visualize the gap between your current savings and your target goal. Seeing a chart that shows your "Months of Coverage" climbing from 3 months to 6 months provides a psychological boost that a static number in a cell cannot replicate. While an Excel Emergency Fund Tracker relies on static formulas, Quadratic allows you to visualize your trajectory using Python libraries, giving you a clearer picture of your progress.
When to adjust your target
Life changes often require a recalibration of your financial goals. Events like moving to a new house, having a baby, or a shift in income can drastically alter your burn rate. For such changes, a family budget app can be particularly useful in adapting your financial plan.
In a static system, you would need to remember to go back and update your spreadsheet formulas. In a dynamic tracker, these changes are flagged automatically because the underlying expense data shifts. If your rent doubles, your "Essential Burn Rate" will increase, and your "Months of Coverage" will decrease instantly, alerting you that you need to increase your savings to maintain the same level of security.
Conclusion: move from guessing to knowing
Financial resilience is not about hitting a static number you scribbled on a napkin two years ago. It is about knowing, with certainty, how long you can weather a storm based on your life as it exists today.
By moving away from static web calculators and building a connected Emergency Fund Tracker in Quadratic, you gain a true picture of your financial health. You stop hoping you have enough and start knowing exactly where you stand. When you have real-time data, you can make informed decisions that turn financial anxiety into financial confidence.
Use Quadratic to track your emergency fund
- Automate live cash balances: Connect directly to your financial accounts to instantly sync your total available cash, eliminating manual updates and ensuring your asset figures are always current.
- Calculate your true "burn rate" dynamically: Use Python and SQL within the grid to analyze historical spending, differentiate essential from discretionary expenses, and get an accurate, real-time monthly cost of living.
- Track your financial runway in real-time: Automatically update your "months of coverage" by dividing your live cash by your dynamic burn rate, providing immediate feedback on your financial security.
- Visualize progress and scenarios: Create charts and dashboards to see your emergency fund grow and model different scenarios (e.g., "bare bones" vs. "comfortable" runway) to make informed decisions.
- Eliminate manual data entry and human bias: Leverage spreadsheet automation to keep your tracker current and accurate, ensuring your financial safety estimates are always based on real data, not guesswork.
Stop guessing and start knowing your financial runway today. Try Quadratic.