Quadratic vs Google Sheets
A better way to do Google Sheets stock analysis
GOOGLEFINANCE gives you basic quotes. Quadratic gives you Python, AI, deep financial data, and 50+ data connections — all in a familiar spreadsheet. No add-ons required.
Where Google Sheets falls short for investors
Google Sheets is great for basic spreadsheet tasks. But when it comes to stock market analysis, you quickly hit limitations that require workarounds, add-ons, or switching to other tools entirely.
GOOGLEFINANCE hits a wall
Google Sheets' GOOGLEFINANCE function gives you basic quotes and limited historical data — but no financial statements, no technical indicators, no options data, and no real-time prices. Once you need depth, you need add-ons.
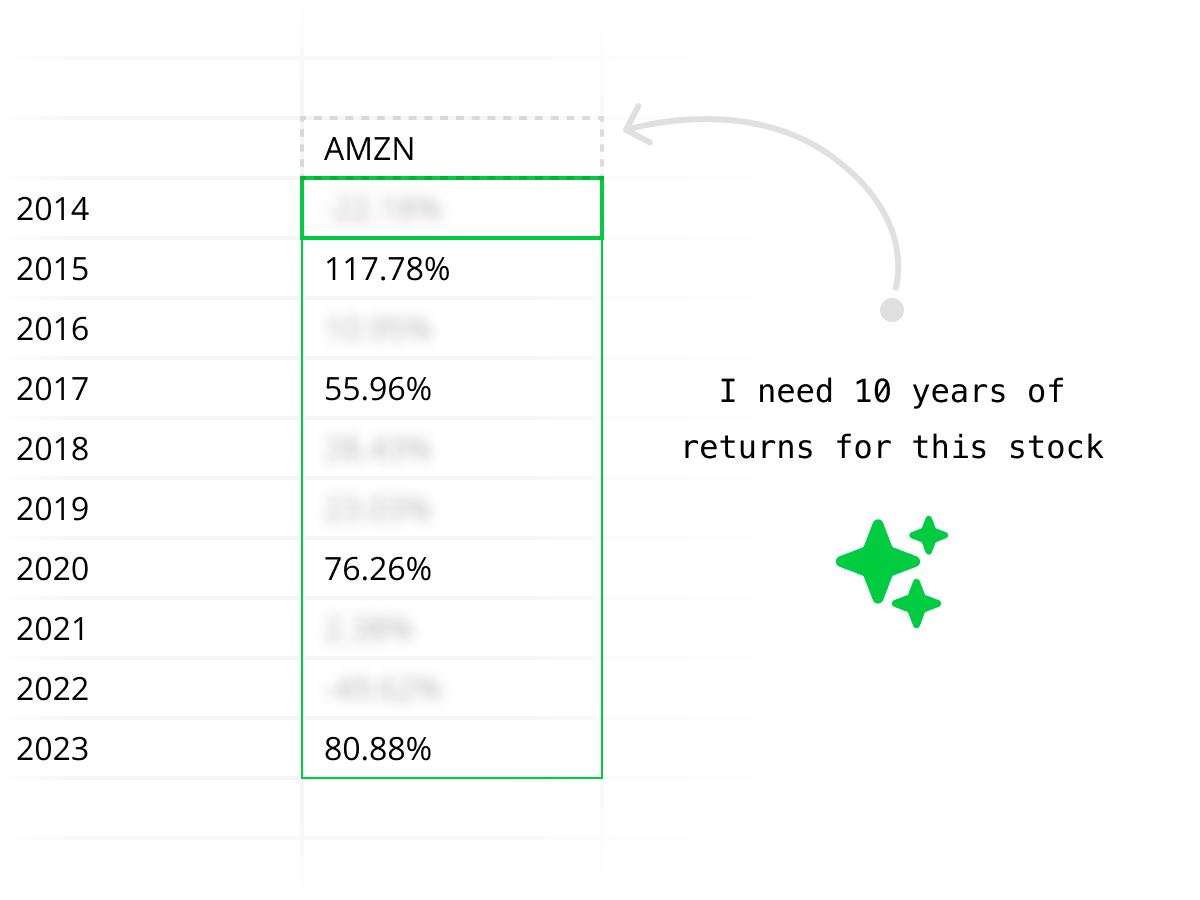
No Python means no real analysis
Want to calculate Sharpe ratios, run regressions, build factor screens, or backtest a strategy? In Google Sheets, you're limited to formulas. In Quadratic, you write Python directly in cells with pandas, numpy, and any library you need.
Add-on fatigue
Getting serious stock data into Google Sheets means installing third-party add-ons — each with its own pricing, rate limits, and quirks. Quadratic has data access built in, so you never need to evaluate, install, or pay for separate plugins.
AI that can't fetch or analyze data
Google Sheets' AI can help with formulas, but it can't query financial APIs, pull stock prices, or generate Python analysis. Quadratic's AI does all three — ask for data and analysis in plain English.
Everything Google Sheets does, plus everything it doesn't
Quadratic is a spreadsheet — formulas, charts, collaboration — with Python, AI, and data integrations built into the core. Not bolted on as add-ons.
AI that fetches financial data
Ask "Pull Tesla quarterly revenue for the last 3 years" and Quadratic's AI queries the right APIs, writes the code, and returns structured data to your grid. Google Sheets' AI can't do this.
Python in every cell
Use pandas for data manipulation, numpy for calculations, scikit-learn for regressions — directly in spreadsheet cells. Google Sheets limits you to formulas and Apps Script.
50+ built-in data connections
Connect to Postgres, MySQL, Snowflake, REST APIs, and more — natively. Google Sheets mostly stays in the Google ecosystem and charges for Workspace add-ons to expand.
GOOGLEFINANCE vs Quadratic data access
Google Sheets' GOOGLEFINANCE function gets you started. Quadratic takes you the rest of the way.
Google Sheets
GOOGLEFINANCE("AAPL", "price")
- Real-time quotes delayed 15+ minutes
- Limited historical data range
- No financial statements or fundamentals
- No technical indicators
- Breaks frequently for certain tickers
- No options, ETF holdings, or sector data
Quadratic
"Pull 12 months of AAPL daily prices and quarterly revenue"
- Real-time quotes and intraday data
- Full OHLCV history across any date range
- Income statements, balance sheets, cash flow
- RSI, MACD, Bollinger Bands, moving averages
- STOCKHISTORY formula + AI + Python — three ways to access data
- Options chains, ETF holdings, sector performance, and more
AI that actually understands finance
Quadratic's AI doesn't just help with spreadsheet formulas — it queries financial APIs, pulls real market data, writes Python analysis, and returns structured results to your grid. Ask for stock comparisons, financial statements, or technical setups in plain English.

Enterprise-grade security
Quadratic is SOC 2 and HIPAA compliant with self-hosting options for enterprises that need full control. Run financial analysis workflows with the security standards your organization requires.
Explore every kind of market data
From historical prices to live quotes, financials to macro — all the market data you need, directly in your spreadsheet.
Historical stock prices
Pull daily, weekly, or intraday OHLCV data for any publicly traded stock. Backtest strategies, compare tickers, and analyze price trends over any time horizon.
| # | Date | Open | High | Low | Close | Volume |
|---|---|---|---|---|---|---|
| 1 | 2025-06-09 | 244.12 | 246.89 | 243.50 | 245.67 | 58,312,400 |
| 2 | 2025-06-06 | 242.35 | 244.80 | 241.90 | 244.12 | 62,187,200 |
| 3 | 2025-06-05 | 240.78 | 243.15 | 240.10 | 242.35 | 55,843,600 |
| 4 | 2025-06-04 | 238.90 | 241.50 | 238.25 | 240.78 | 49,721,800 |
| 5 | 2025-06-03 | 237.45 | 239.80 | 236.90 | 238.90 | 51,456,300 |
| 6 | 2025-06-02 | 235.20 | 238.10 | 234.85 | 237.45 | 53,892,100 |
| 7 | 2025-05-30 | 233.60 | 236.25 | 233.10 | 235.20 | 47,218,500 |
| 8 | 2025-05-29 | 231.85 | 234.40 | 231.20 | 233.60 | 44,567,900 |
Outgrown GOOGLEFINANCE? Try Quadratic.
Quadratic vs Google Sheets: full comparison
Google Sheets is a great general-purpose spreadsheet, and a Google Sheets stock tracker can work for basic monitoring. But for deeper stock analysis, Quadratic is built for the job.
| Capability | Quadratic | Google Sheets |
|---|---|---|
| Python | Built-in — runs natively in cells with full library access | Not available (Apps Script only) |
| AI assistant | Generates Python, fetches data, builds analysis from plain English | Basic Gemini features, limited to spreadsheet tasks |
| Stock data access | Built-in AI + STOCKHISTORY formula + Python APIs, no setup | GOOGLEFINANCE (limited, delayed) or paid add-ons |
| Financial statements | AI pulls income statements, balance sheets, cash flow on demand | Not built in — requires add-ons or manual import |
| Technical indicators | Python-generated RSI, MACD, Bollinger Bands, moving averages | Manual formulas only — no native indicator support |
| Data connections | 50+ built-in connections (databases, APIs, files) plus any REST API via Python | Limited to Google ecosystem + paid third-party add-ons |
| Data libraries | pandas, numpy, scipy, scikit-learn, and more available in-cell | None — formulas only |
| Visualization | Built-in charts + Python plotting (Plotly, matplotlib) | Built-in charts only |
| Historical data depth | Full OHLCV history, intraday, multi-year ranges | GOOGLEFINANCE limited to ~5 years, delayed 15+ min |
| Enterprise security | SOC 2, HIPAA compliant, self-hosting available | Google Workspace security, no self-hosting |
The Python advantage Google Sheets doesn't have
Python in a spreadsheet changes what's possible. These workflows are straightforward in Quadratic and impossible in Google Sheets without external tools.
Multi-stock return comparison
Compare cumulative returns across a basket of stocks with three lines of pandas.
returns = prices.pct_change()
cumulative = (1 + returns).cumprod()
result = cumulative[["AAPL","MSFT","GOOG"]]
Financial ratio screening
Filter stocks by fundamentals — something that takes dozens of formulas in Google Sheets.
value_stocks = fundamentals[
  (fundamentals["pe"] < 15) &
  (fundamentals["roe"] > 0.12) &
  (fundamentals["debt_equity"] < 1.5)
]
Correlation matrix
Build a correlation matrix for portfolio diversification analysis in one line.
correlation = returns[tickers].corr()
result = correlation.round(3)
Rolling technical indicators
Calculate and compare multiple indicators across tickers simultaneously.
df["sma_50"] = df["close"].rolling(50).mean()
df["rsi"] = compute_rsi(df["close"], 14)
df["bb_upper"] = df["sma_20"] + 2*df["std_20"]
Quadratic vs Google Sheets FAQ
How is Quadratic different from Google Sheets for stock analysis?
Quadratic is a spreadsheet like Google Sheets, but with Python, AI, and deep data integrations built in. Google Sheets gives you GOOGLEFINANCE for basic quotes and limited history. Quadratic gives you AI-powered data fetching, a STOCKHISTORY formula, full Python support, and connections to 50+ data sources — all without add-ons.
Can Quadratic replace Google Sheets for stock market data analysis?
For stock market analysis and financial data workflows, yes. Quadratic gives you everything Google Sheets offers — formulas, charts, collaboration — plus Python in cells, AI that fetches and analyzes market data, and built-in connections to financial APIs. You get a more powerful analysis tool without leaving the spreadsheet format.
What can I do in Quadratic that I can't do in Google Sheets?
Write Python directly in cells (pandas, numpy, scikit-learn), ask AI to pull financial statements and stock data, calculate technical indicators like RSI and MACD with generated code, connect to 50+ databases and APIs natively, and run full data science workflows — all in one spreadsheet.
Is GOOGLEFINANCE good enough for stock analysis?
GOOGLEFINANCE is useful for basic real-time quotes and simple historical lookups, but it has significant limitations: data is delayed 15+ minutes, historical data is limited, there's no access to financial statements or technical indicators, and it often breaks for certain tickers or data types. Most serious analysts outgrow it quickly.
Do I need add-ons to get stock data in Quadratic?
No. Quadratic has built-in stock market data access through AI and the STOCKHISTORY formula. You can pull historical prices, financial statements, technical indicators, and company fundamentals without installing anything. You can also use Python to connect to any API directly.
Can Quadratic replace my Google Sheets stock tracker?
Yes. You can import your existing Google Sheets stock tracker into Quadratic, then add AI, Python, real market data, charts, and deeper analysis without relying on add-ons.
Can I collaborate in Quadratic like Google Sheets?
Yes. Quadratic supports real-time multiplayer collaboration with sharing and permissions — the same experience you're used to in Google Sheets, but with Python and market data built in.
Is Quadratic free?
Yes. Quadratic has a free tier that includes the spreadsheet, Python, AI, built-in data connections, and charting. There are paid plans for teams and enterprises that need additional features like self-hosting and advanced security.
Can I import my Google Sheets into Quadratic?
You can export your Google Sheets data as CSV or Excel files and open them in Quadratic. From there, you can enhance your analysis with Python, AI, and built-in data connections that aren't available in Google Sheets.