Explore pre-built financial templates
Take your Hologic revenue analysis further with ready-to-use Quadratic templates designed for investors and analysts.
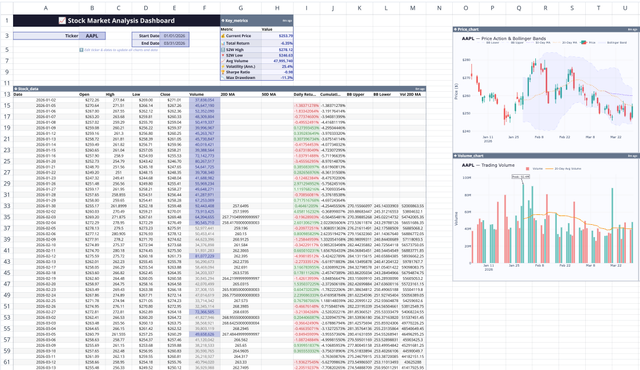
Stock Market Analysis Template
Study the markets with an interactive spreadsheet tracking any publicly traded company.
Try template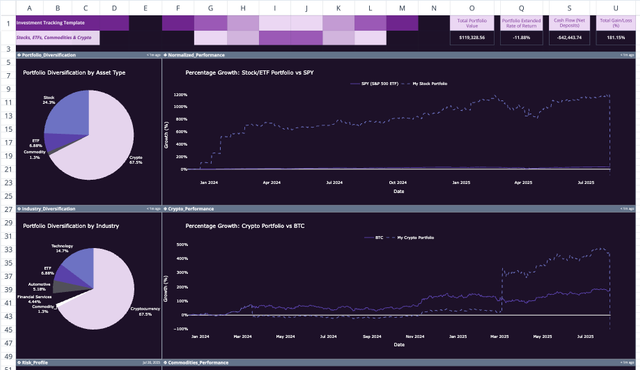
Investment Tracking Spreadsheet Template
Upgrade your investment management with advanced analytics.
Try templateHOLX Financial Analysis FAQs
How can I analyze HOLX financial data with AI?
You can use Quadratic to analyze Hologic (HOLX) financial data by scraping online sources, connecting live API data, and asking AI natural-language questions about revenue, earnings, growth, or valuation. Quadratic instantly visualizes and explains HOLX's financial trends without leaving the spreadsheet.
Can I forecast Hologic's future performance?
Yes. Quadratic helps you forecast HOLX's future revenue, margins, or stock performance using Python-powered modeling. You can pull live financial data, apply predictive formulas, and generate visual projections of Hologic's potential growth directly inside your Quadratic workbook by just asking the AI.
What live data can I pull for HOLX?
Quadratic's AI Research feature lets you pull live data from the web — including HOLX's financial statements, analyst estimates, and market trends — and combine it with your own datasets, CSVs, or APIs for deeper analysis and visualization.
Can I compare HOLX with competitors?
Absolutely. Use Quadratic to compare HOLX against competitors in the same industry. The AI can pull comparable company data, calculate ratios like P/E or P/S, and visualize how Hologic's performance stacks up against the market.
How do I visualize HOLX financial trends?
You can create charts and dashboards directly in Quadratic. The AI can automatically turn HOLX data into graphs showing revenue growth, profit margins, valuation multiples, and more, all within the same spreadsheet.
Where does Quadratic get HOLX data from?
Quadratic can connect to multiple sources — from CSV and Excel uploads to SQL databases, APIs, and web data — allowing you to gather HOLX's latest financial information from trusted sources in real time.
Can I collaborate on my HOLX analysis?
Yes, Quadratic supports real-time collaboration. You can invite teammates to analyze Hologic's financial data together, run AI-powered research, and share dashboards, all in a secure, browser-based spreadsheet.
How can I use Quadratic for ongoing HOLX research?
Set up a live Quadratic sheet to track HOLX over time. Use AI to refresh data from the web or connect to a public API, update forecasts automatically, and identify new financial trends as they emerge, turning your spreadsheet into a living research tool.