Cash flow is the lifeline of any business, yet the process of tracking it often falls into a chaotic gap, leading to common cash flow management challenges. For many small businesses and agencies, accounts receivable exists in a state of limbo between static, fragile spreadsheets and expensive, rigid enterprise software. You need to know who owes you money and when it is coming in, but your tools often make that simple question difficult to answer.
The limitations of a standard accounts receivable tracking spreadsheet are well known to anyone who has managed finance operations. Formulas break when rows are added, version control is nonexistent, and visualization usually requires manual updates. On the other hand, dedicated ERP systems are often overkill for a nimble agency.
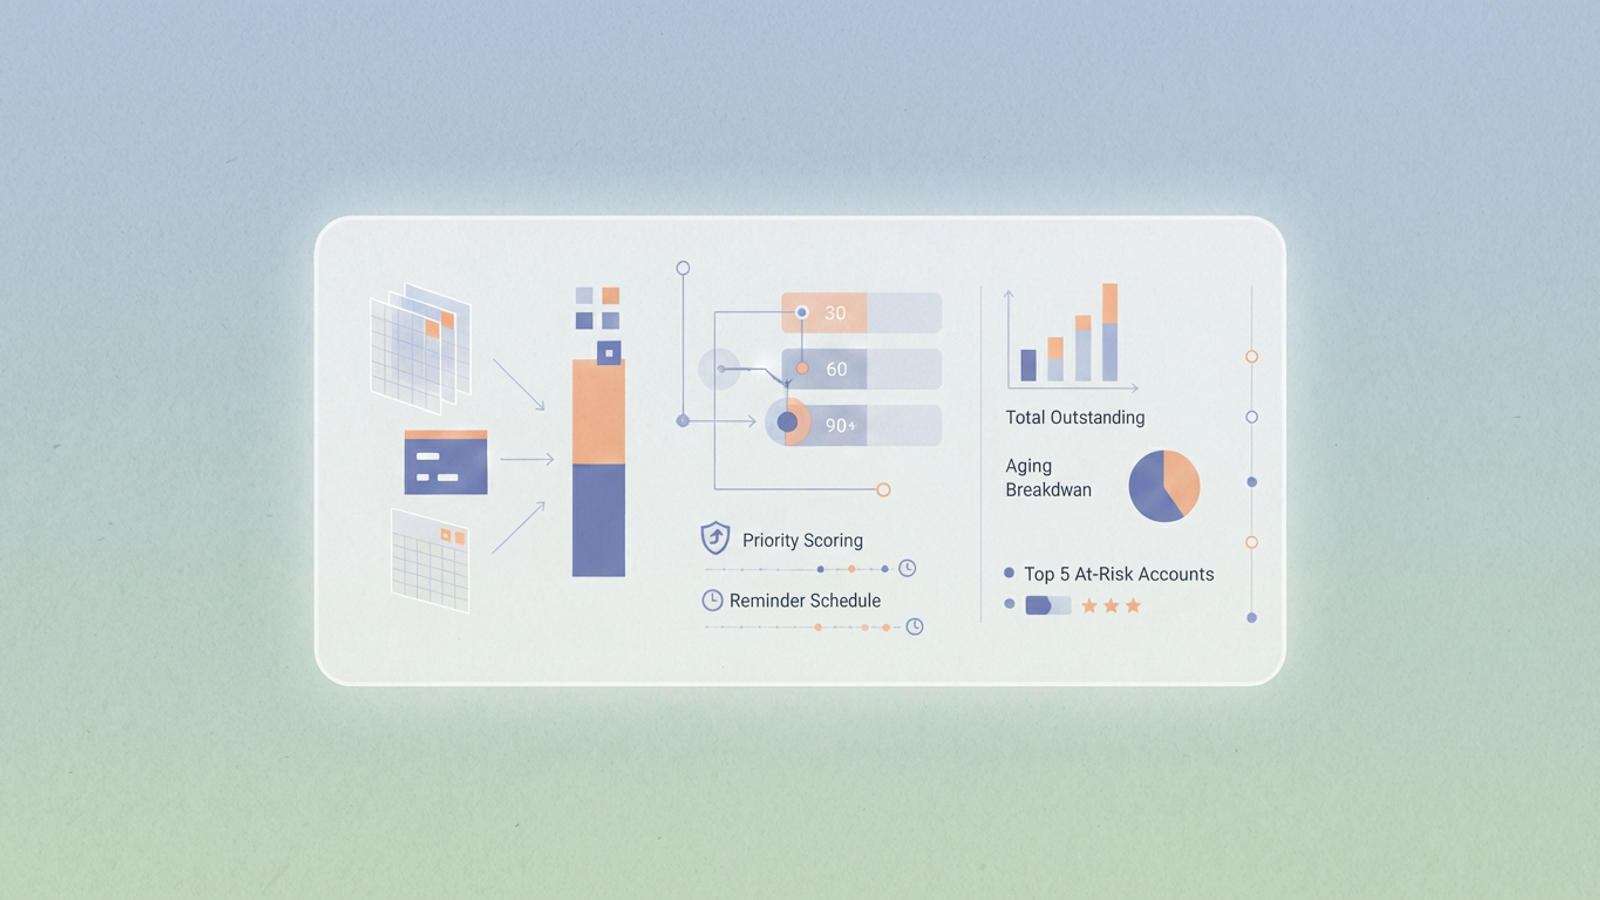
This article explores a third option: the "Flexible Middle." We will look at how a real-world agency built a bespoke accounts receivable system in Quadratic. By combining the flexibility of a spreadsheet with the power of Python-driven dashboards and strict audit logs, they created a workflow that ensures they get paid on time without the overhead of enterprise software.
Moving beyond the static spreadsheet
When finance leads look for free software for accounts receivable vs manual tracking, they are usually trying to escape the error-prone nature of manual entry. In a traditional spreadsheet, a date is just a string of text. If someone accidentally types "Oct 32" or leaves a trailing space, the entire aging formula breaks.
The agency in this use case started with a familiar data structure. They needed to capture invoice data including Invoice Date, Due Date, Payment Terms, Client Contact, and Partial Payments. However, they moved this data into Quadratic to leverage strict typing and data integrity.
Unlike a standard accounts receivable tracking template where any cell can hold any data, this agency used Python to enforce data quality. By treating their invoice list as a structured dataset, they ensured that dates were valid datetime objects and amounts were strictly numeric. This foundational step prevented the common "garbage in, garbage out" issues that plague manual trackers, ensuring that every downstream calculation—from aging buckets to cash flow forecasts—was accurate.
The logic: automating aging buckets and priority scoring
One of the most critical metrics in finance is Days Sales Outstanding (DSO). To effectively track accounts receivable, you need to know not just how much is owed, but how long it has been owed, which is typically assessed through accounts receivable aging. In a typical spreadsheet, creating aging buckets (0–30 days, 31–60 days, 60+ days) often involves complex nested "IF" statements that are difficult to audit and easy to break.
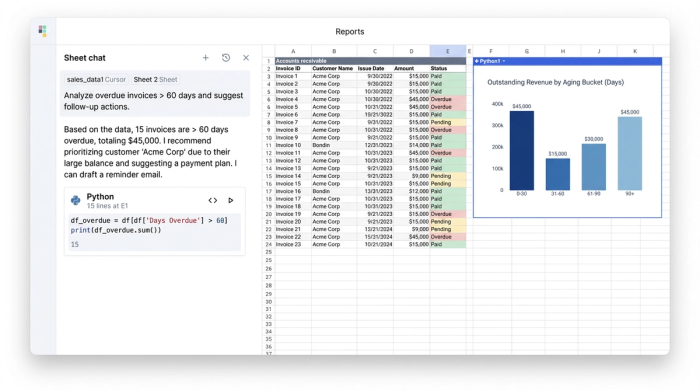
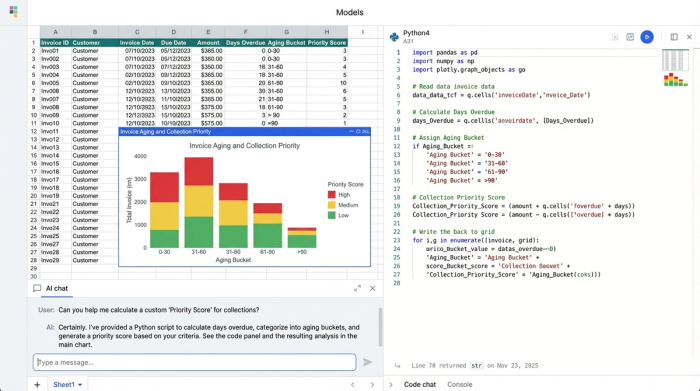
The agency automated this analysis completely. Instead of manual filtering, they wrote a simple Python script within Quadratic to bucket invoices automatically. As soon as the "Days Past Due" calculation changed based on the current date, the invoice was instantly re-categorized into the correct bucket.
Furthermore, they took their tracking accounts receivable workflow a step further by implementing a "Collection Priority Score." They realized that a large invoice that is two days late is important, but a medium invoice that is 90 days late is urgent. They wrote a script that combined the Amount Due with Days Past Due to generate a weighted score. This generated a dynamically sorted list, telling the finance team exactly who to call first every morning. This level of custom logic is rarely found in off-the-shelf software but is trivial to implement in a code-enabled spreadsheet.
The visualization: building the AR dashboard
Data is only useful if it leads to action. A common frustration with an accounts receivable tracker excel file is the difficulty of visualization. Charts often live on separate tabs, and if you add new data rows, the chart ranges often fail to update, requiring manual adjustment.
The agency utilized Quadratic’s infinite canvas to solve this. Instead of hiding insights in a separate tab, they built their dashboard directly next to their data. Because the visualization is powered by Python, it updates dynamically. If the dataset grows from 100 invoices to 1,000, the code automatically captures the new rows without the user needing to drag and select cells.
The dashboard features clear visual elements:
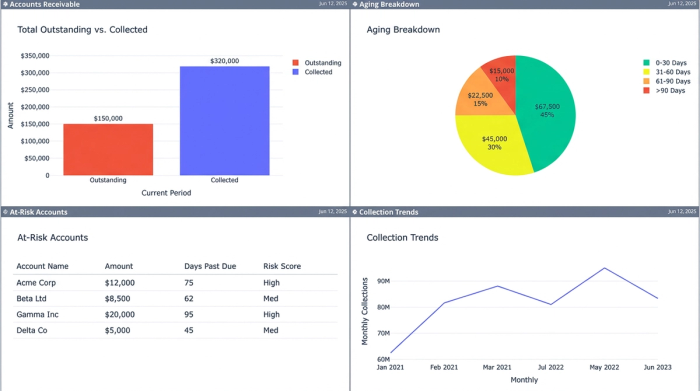
- Total Outstanding vs. Collected: A bar chart providing an instant snapshot of monthly cash flow.
- Aging Breakdown: A pie chart showing the percentage of revenue tied up in the 30, 60, and 90+ day buckets.
- At-Risk Accounts: A "Top 5" list generated by the priority score, highlighting the clients that require immediate attention.
This setup transforms the document from a passive list of numbers into an active command center for the finance team.
The safety net: audit trails and status changes
A major source of anxiety for operations managers is data integrity, especially in processes like transaction reconciliation. In a shared file, if a cell containing an invoice amount is deleted or changed to "Paid" by mistake, it can cause significant financial discrepancies. This fear drives many teams to look for the best alternatives to manual accounts receivable tracking.
The agency required strict accountability. They needed to track status changes, such as when an invoice moved from "Sent" to "Sent to Collections" or "Promise to Pay."
Quadratic provided the necessary safety net through its granular history features. Unlike standard spreadsheets where "undo" is the only safety mechanism, Quadratic maintains a clean log of who changed a cell and when, providing a robust audit trail. If an invoice status was flipped to "Paid," the finance lead could right-click the cell and see exactly which team member made the change and at what time. This audit trail capability brings the security usually reserved for enterprise accounts receivable tracking software into the flexible spreadsheet environment.
Comparison: Excel templates vs. SaaS vs. Quadratic
For businesses stuck in the middle, the choice of tools can be paralyzed. It helps to view the landscape in terms of flexibility, automation, and integrity.
- Option A (accounts receivable and payable tracking template in excel): This offers high flexibility because you can change anything, but low automation and low data integrity. Formulas break easily, and there is no audit trail.
- Option B (SaaS Tools): Dedicated software offers high automation and high integrity, but low flexibility. You are forced to use their workflows, their reports, and their pricing structure.
- Option C (Quadratic): This represents the "Flexible Middle." You get high flexibility because you can build custom logic (like the priority score). You get high automation through Python scripting. Crucially, you get high integrity through strict typing and audit trails.
While a basic accounts receivable tracking spreadsheet is free, the cost of errors can be high. Quadratic bridges the gap, offering the structure of a database with the interface of a spreadsheet.
Why the "flexible middle" wins
The agency in this use case chose this route because they had specific needs that neither a template nor a rigid SaaS tool could meet. They needed their specific "Collection Priority Score" to manage their workflow, but they also needed the reliability of an audit trail to ensure their financial data was secure. Quadratic allowed them to build a tool that fit their business, rather than forcing their business to fit a tool.
Conclusion: gaining control over cash flow
Effective accounts receivable tracking is not just about listing invoices; it is about generating actionable insights and having absolute trust in your data. When you know exactly which accounts are aging and have a prioritized list of who to contact, you move from reactive fire-fighting to proactive cash flow management.
For teams that are outgrowing their manual processes but aren't ready for an expensive ERP implementation, the solution isn't necessarily a new piece of dedicated software. It is often a better, smarter spreadsheet. Stop relying on fragile templates and try building a data-backed AR workflow in Quadratic.
Use Quadratic to Streamline Accounts Receivable Tracking
- Ensure data accuracy and integrity for all invoice details by leveraging strict typing (valid dates, numeric amounts) with Python, preventing common spreadsheet errors.
- Automate accounts receivable aging and collection priority scoring with custom Python scripts that dynamically categorize invoices and highlight urgent accounts.
- Build real-time, interactive dashboards directly within your workspace to visualize outstanding amounts, aging breakdowns, and at-risk clients without manual updates.
- Track every change with robust audit trails, seeing exactly who modified an invoice status or data point and when, ensuring accountability and compliance.
- Customize your AR workflow with unique logic, like a weighted "Collection Priority Score," combining the flexibility of a spreadsheet with the power of code.
Gain control over your cash flow and build a smarter AR workflow. Try Quadratic.