Financial modeling for microfinance institutions is uniquely difficult. Unlike traditional commercial banking, where a few large loans drive the portfolio, microfinance requires tracking high volumes of low-value loans, often with complex repayment schedules and heavy operational overhead. When you add a second business model into the mix—such as a financial brokerage that generates immediate commissions—standard spreadsheet templates often break.
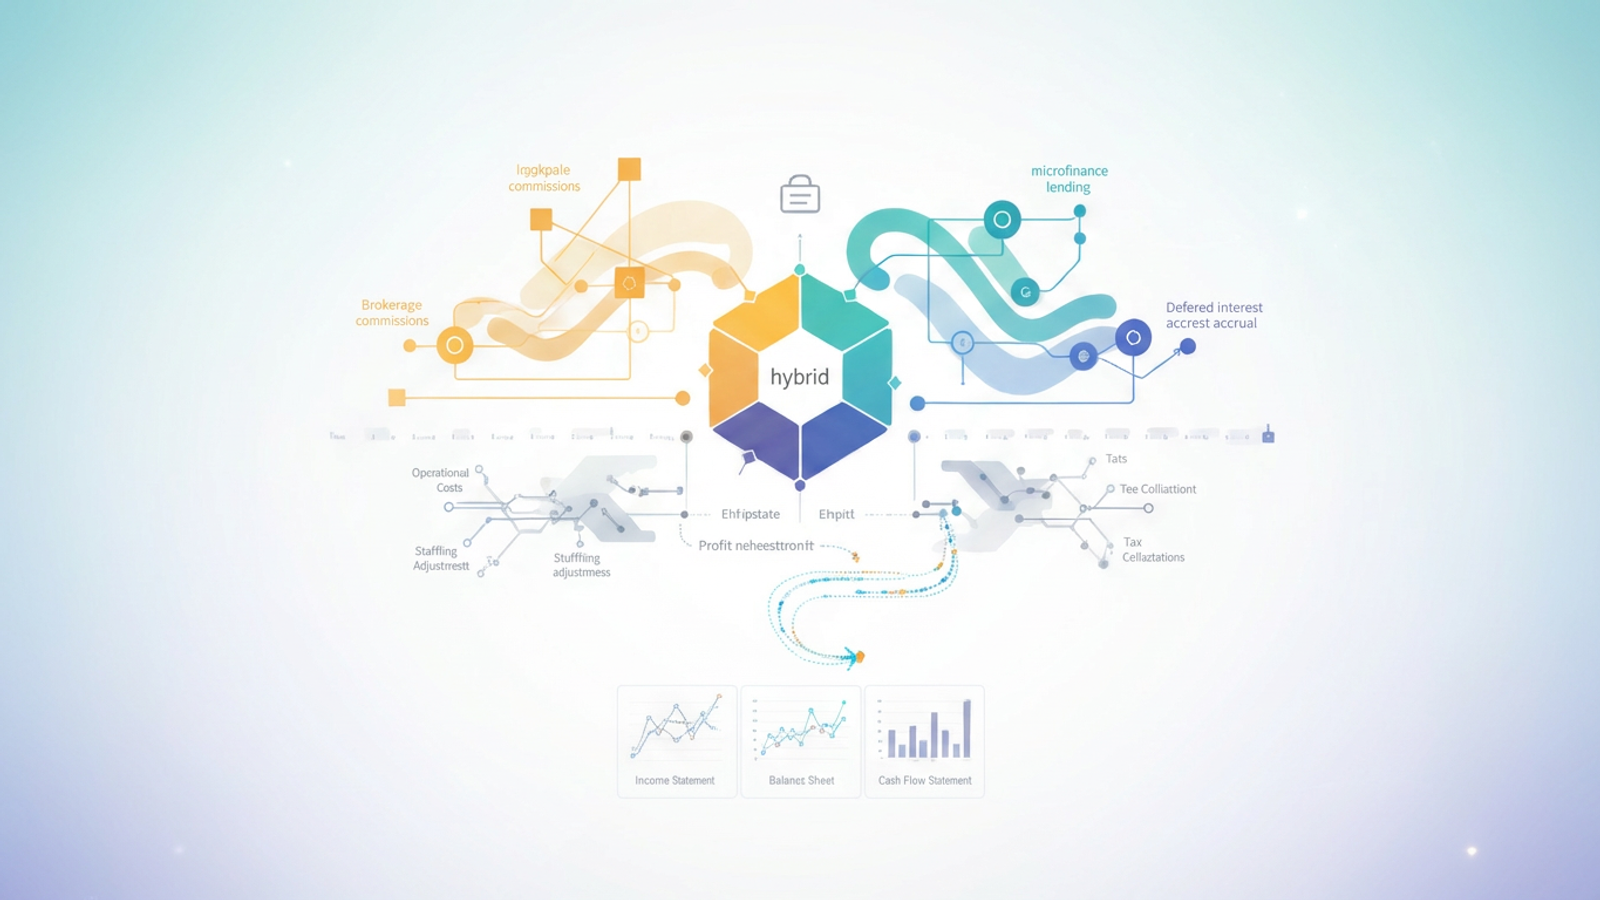
We recently observed a financial professional tackling this exact "hybrid" challenge. They needed to model a business that acted as both a broker (generating upfront cash) and a microfinance lender (generating deferred interest). In a traditional spreadsheet, combining these two distinct revenue timelines usually leads to brittle, hard-coded logic and circular reference errors.
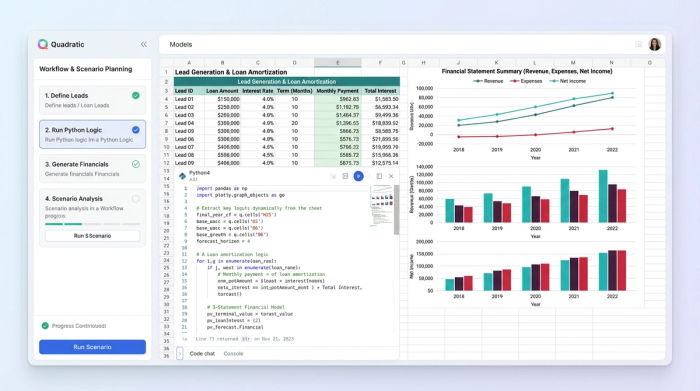
Instead of fighting against the limitations of a standard grid, this user built a parameterized, dynamic projection model in Quadratic. By leveraging Python alongside standard formulas, they automated the flow from raw lead generation to a full 3-statement financial output, creating a tool that is robust enough for board-level scenario planning but flexible enough to handle daily operational adjustments.
The challenge: modeling hybrid revenue streams
The core difficulty in this use case was the timeline mismatch between revenue streams. Brokerage commissions are recognized immediately upon closing a deal, whereas microfinance lending rates generate revenue over time through interest accrual. In Excel, trying to model these side-by-side often results in a "spaghetti" spreadsheet where cash flow formulas become unreadable strings of cell references.
The user solved this by utilizing Quadratic’s ability to separate logic paths within the same canvas. They created specific Python functions to handle the amortization schedules for the lending side, while keeping the brokerage commission logic in standard formulas. This separation allowed them to define the distinct economics of each stream clearly.
For the lending side, the model had to account for the fact that microfinance operations carry higher relative costs per dollar lent. By using Python variables to define these operational costs, the user could adjust the spread between the cost of capital and the lending rate without breaking the downstream formulas that calculated net revenue.
Structuring the loan portfolio and lending models
A static model assumes one way of doing business, but a dynamic model allows for strategic pivots. One of the most impressive features of this user’s model was the ability to toggle between different lending methodologies to see how they impacted risk and return.
Specifically, the model allowed the user to switch between individual liability loans and the group lending model in microfinance. This is a critical distinction for risk management. When the "Group Lending" parameter was active, the model automatically adjusted the assumed default rates downward, reflecting one of the primary advantages of group lending in microfinance: social collateral often leads to higher repayment rates.
Technically, this was executed by creating a flow of data that moved from "Leads" to "Deals" and finally to "Active Loans." Rather than manually entering loan batches, the user set conversion rate parameters. If they increased the marketing budget, the model calculated the influx of leads, applied the conversion rate, and automatically populated the "Active Loans" cohort. This dynamic structure meant that the loan book grew organically based on the inputs, rather than requiring manual updates for every new period.
Handling complex tax and operational logic
Revenue is only half the story. To create a realistic net income projection, the user had to model a granular expense structure that included Value Added Tax (VAT), income tax, and variable operational costs.
In traditional spreadsheets, tax logic is often hidden inside complex cell formulas (e.g., *0.20), making it difficult to update if regulations change. The user took a different approach by utilizing global parameters. They defined variables like tax_rate and vat_rate in a central code block. These variables were then referenced throughout the model.
This approach was particularly useful for staffing and operational expenses (OpEx). As the loan portfolio grew, the model automatically triggered "hiring" events based on logic defined in Python (e.g., "hire one loan officer for every 100 active loans"). This ensured that the expense side of the ledger remained realistic relative to revenue growth, preventing the common modeling error where revenue scales infinitely while costs remain flat.
The output: automating the 3-statement model
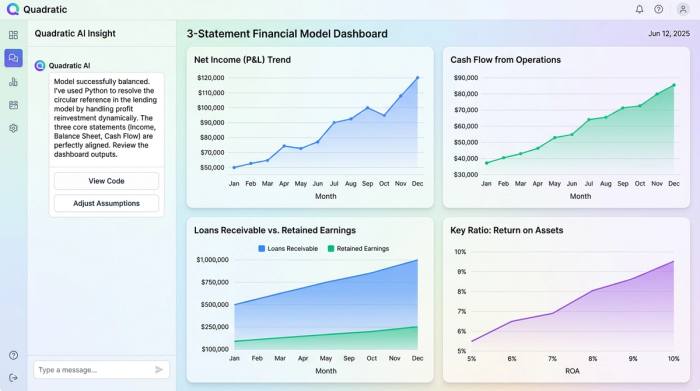
While the internal logic of the model was custom-built for a hybrid fintech business, the output had to conform to standard financial reporting. The user successfully mapped their data streams to generate the three core financial statements: the Income Statement, Balance Sheet, and Cash Flow Statement.
The Income Statement aggregated the immediate brokerage commissions and the deferred interest income, subtracting the granular OpEx and tax calculations to arrive at Net Income. The Cash Flow Statement was particularly critical for this business model because of the reinvestment cycle.
A common pain point in lending models is circularity: profits from current loans are often reinvested to fund new loans. In standard spreadsheets, this creates circular reference errors that require enabling "Iterative Calculation," which can be unstable. Because Quadratic allows for structured data flow using Python, the user able to define the reinvestment logic sequentially. The model calculated available cash from the previous period's profits and allocated it to the current period's lending capital without causing calculation errors. This resulted in a Balance Sheet that balanced perfectly every month, tracking the growing asset base (loans receivable) against equity (retained earnings).
Scenario analysis: moving from static to dynamic
The true value of this model lay in its interactivity. It was not just a record of what happened, but a sandbox for predicting what could happen. The user effectively turned a static document into a parameterized application.
This allowed the finance team to ask complex "what if" questions during strategy meetings and get immediate answers. For example, they could test the sensitivity of the portfolio if microfinance lending rates dropped by 2% due to competitive pressure. They could analyze the financial impact of shifting the portfolio mix entirely toward group lending microfinance strategies to mitigate risk during an economic downturn.
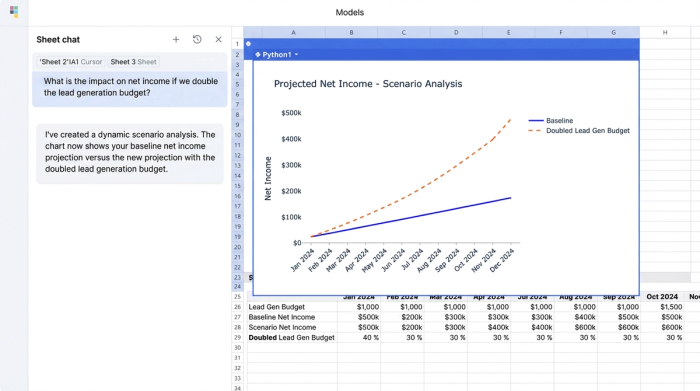
They could also simulate operational changes, such as doubling the lead generation budget. The model would instantly recalculate the entire multi-period horizon—updating the budget requirements, the expected number of defaults, and the resulting profits. This capability moved the organization away from static quarterly reports and toward continuous, dynamic planning.
Conclusion
This user story highlights a shift in how modern financial professionals are approaching complex modeling. By moving away from the fragility of traditional spreadsheets and embracing a tool that combines grid familiarity with the power of code, this analyst successfully modeled a hybrid business that would have broken a standard template.
For analysts working in niche or complex sectors like microfinance lending, the ability to define custom logic, handle circular dependencies gracefully, and automate 3-statement outputs is essential. It transforms financial modeling from a data entry task into a strategic asset.
If you are struggling with a spreadsheet that crashes under the weight of your business logic, it might be time to upgrade your toolkit. Try building your next dynamic financial model in Quadratic.
Use Quadratic to model microfinance lending
- Combine diverse revenue streams like immediate brokerage commissions and deferred microfinance interest without creating brittle, hard-coded logic.
- Separate complex calculations using Python for amortization schedules and standard formulas for simpler logic, keeping your model clean and readable.
- Automate dynamic loan portfolio growth by setting conversion rates from leads to active loans, allowing the loan book to scale organically.
- Build flexible lending models that toggle between individual and group lending, automatically adjusting default rates and risk parameters.
- Manage granular operational costs and taxes with centralized Python variables, making it easy to update assumptions and scale expenses with revenue.
- Resolve circular dependencies in reinvestment logic gracefully, ensuring your 3-statement financial model balances perfectly without manual iteration.
- Perform interactive scenario analysis to instantly see the financial impact of changing lending rates, marketing budgets, or operational strategies.
Ready to build a more robust financial model? Try Quadratic.