
Table of contents
- Moving beyond static lists: why modern tax analysis requires code
- The methodology: what is effective rate decomposition?
- Step-by-step: building the comparative model in Quadratic
- Sensitivity analysis: stress-testing the client’s future
- Visualizing the output for client advisory
- Conclusion: the future of financial modeling
For modern finance professionals, the definition of "tax analysis" has fundamentally shifted. It has evolved from a historical compliance exercise—simply filing returns based on past events—into a forward-looking, strategic advisory service. Clients today demand more than just a year-end summary; they require a roadmap that navigates the complex interplay of income shifts, deduction timing, and legislative volatility, supported by stronger QuickBooks analytics and financial modeling.
However, the tools used to deliver this advice have not kept pace with the demand. Standard spreadsheets often struggle to handle multi-year scenarios involving changing variables. While finance professionals can easily find lists of static "year-end tips," translating those tips into a dynamic model that shows the mathematical impact on a specific portfolio is notoriously difficult. This is where the concept of tax liability decomposition comes into play. By breaking down effective rates into their component drivers using a tool like Quadratic, advisors can isolate exactly why a tax bill is changing and how to mitigate it.
Moving beyond static lists: why modern tax analysis requires code
There is a significant gap in the current landscape of financial guidance. A quick search often yields academic policy papers or basic consumer advice, such as "maximize your 401(k)." There is very little guidance on how to actually model these strategies effectively. The difficulty lies in the complexity of the tax environment.
Tax modeling is not a linear exercise because the variables are constantly in flux. Whether you are modeling the long-term effects of a child tax credit expansion analysis or projecting the outcomes of a Louisiana tax reform analysis, using a static financial forecast template often breaks under the weight of changing variables. In a traditional spreadsheet, attempting to account for phasing out deductions, changing bracket thresholds, and state-specific nuances requires deeply nested logical statements that are prone to error and difficult to audit.
This is where Quadratic offers a distinct advantage. By integrating Python directly into the spreadsheet grid, finance professionals can replace fragile formulas with robust scripts. This allows for logic that can handle the complexity of progressive tax brackets and legislative shifts without the risk of breaking the entire model every time a variable changes.
The methodology: what is effective rate decomposition?
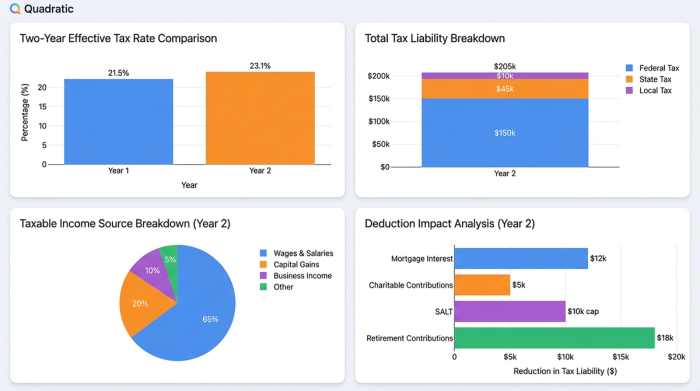
To provide high-value advisory, professionals must move beyond reporting the total tax bill and start explaining the "why." This is the essence of effective rate decomposition. In academic circles, decomposition refers to breaking a complex value down into its constituent parts. Applied to client advisory, it means isolating the specific drivers that caused the effective tax rate to fluctuate between two periods.
It is rarely a single factor that changes a client's liability. Decomposition allows you to answer specific questions: Did the effective rate change because of a "bracket creep" where income pushed into a higher marginal tier? Was it the result of a specific deduction phasing out due to Adjusted Gross Income (AGI) limitations? Or was it a timing issue regarding charitable contributions?
By treating tax planning as a data science problem, which leverages financial data analytics, rather than a compliance task, you bridge the gap between abstract policy theory and practical, actionable advice. This "missing middle" is where the most valuable client conversations happen.
Step-by-step: building the comparative model in Quadratic
Implementing this methodology requires a workspace that supports data ingestion, scripting, and visualization in one view. Here is how you can build a comparative tax model inside Quadratic.
Step 1: Data ingestion and normalization
The first step is to bring your client’s financial data onto the infinite canvas. Unlike standard spreadsheets that force you into rigid rows and columns, Quadratic allows you to pull data from various sources and arrange it logically. You can ingest income streams, deduction schedules, and credit data across multiple years, which is foundational for a 3 statement financial model. Because Quadratic connects to databases and supports SQL, you can automate the retrieval of this data rather than manually pasting it from different CSV files.
Step 2: Scripting the logic with Python
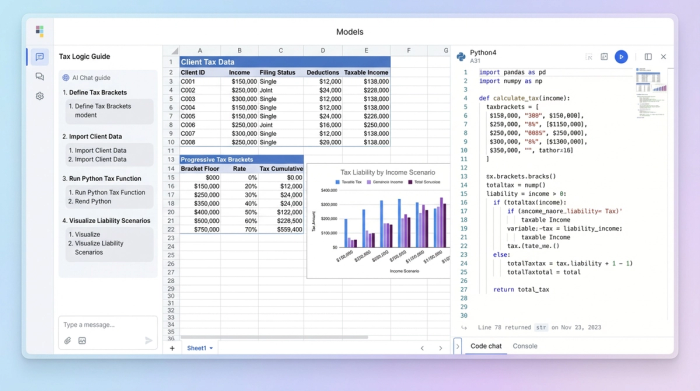
Once the data is in place, you can use Python cells to handle the tax logic. Calculating progressive tax liability in a standard spreadsheet is notoriously painful, often requiring lookup tables and complex logic to determine which dollars fall into which bucket.
With Python, you can write a clean function that iterates through tax brackets to calculate liability instantly. This script-based approach offers immense flexibility. You can create scenarios for extreme outliers—such as a Powerball tax analysis for a sudden windfall or a complex Mega Millions tax analysis—by simply adjusting the income variable in your Python script without rewriting the entire sheet. If the model can handle these extreme edge cases without breaking, it is more than capable of handling standard portfolio volatility.
Step 3: Calculating the decomposition
Finally, you calculate the decomposition. This involves creating a script that compares Year 1 and Year 2. The script calculates the tax liability for Year 2 assuming Year 1’s rules, and then isolates the difference. This allows you to mathematically quantify how much of the tax increase was due to income growth versus how much was due to a change in tax law or deduction eligibility.
Sensitivity analysis: stress-testing the client’s future
Once the core model is built, the next step is sensitivity analysis. While macro-economists use this term to discuss national budgets, in client advisory, it refers to "stress-testing" a financial plan against different future states.
Using Quadratic, you can create "What-If" scenarios to see how sensitive the client's tax liability is to external factors, a core component of fp&a modeling. You might model a scenario where income remains flat versus one where it grows by 10%. More importantly, you can model regulatory risk. For example, you can model the Trump tax cuts budget impact analysis on a specific portfolio to see how the expiration of those cuts would alter your client's five-year horizon.
Quadratic enhances this workflow by allowing you to bind Python variables to UI elements like sliders or input cells. This means you can drag a slider to adjust estimated capital gains and watch the tax liability decomposition update in real-time.
Visualizing the output for client advisory
The ultimate payoff of this analysis is the ability to turn complex math into a narrative the client understands. A spreadsheet full of numbers rarely tells a compelling story, but a powerful financial data visualization can bridge the gap between data and decision-making.
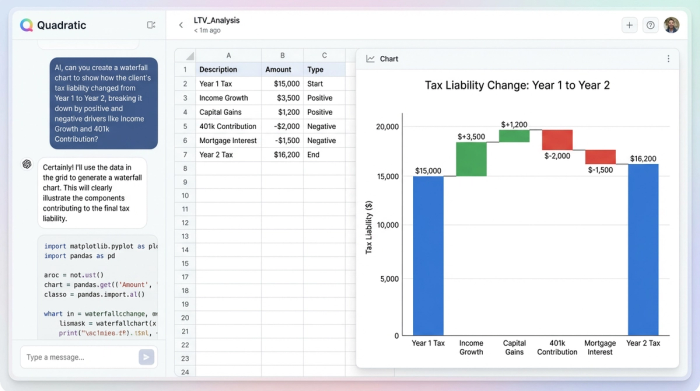
In Quadratic, you can use Python libraries to generate sophisticated visuals, such as a waterfall chart. A waterfall chart is particularly effective for tax liability decomposition because it visually walks the client from their starting tax position to their ending position, with floating bars representing each positive or negative driver (e.g., "Plus: Income Growth," "Less: 401k Contribution," "Plus: Tax Law Change").
This level of professional context is vital. While news cycles focus on headlines like a Hunter Biden tax case pardon analysis, your clients care about their specific bottom line and how it impacts their wealth preservation. Visualization helps filter out the noise and focuses the conversation on the data that matters to them.
Conclusion: the future of financial modeling
True tax analysis requires more than a calculator; it requires a model capable of decomposing liability, handling volatility, and visualizing the results. As tax laws become more complex and client portfolios become more diverse, the reliance on static templates becomes a liability in itself.
By adopting a tool like Quadratic, finance professionals can move toward dynamic, code-backed modeling. This not only improves accuracy but also elevates the advisor from a compliance officer to a strategic partner. It is time to stop struggling with nested formulas and start building models that provide deep, actionable tax analysis for every client scenario.
Use Quadratic to do tax analysis
- Decompose multi-year tax liability: Break down effective rates to precisely identify how income shifts, deduction timing, and legislative changes impact client tax bills.
- Model complex tax scenarios with Python: Replace fragile spreadsheet formulas with robust Python scripts to accurately handle progressive tax brackets, phasing out deductions, and constantly changing legislative rules.
- Automate data ingestion and build comparative models: Connect directly to financial data sources via SQL to ingest multi-year income, deduction, and credit data, then build dynamic comparative models with ease.
- Run dynamic "what-if" and sensitivity analyses: Stress-test client financial plans against various future states and regulatory risks, like the expiration of tax cuts, by adjusting variables with interactive UI elements.
- Visualize complex tax impacts clearly: Generate professional financial data visualizations, such as waterfall charts, using Python libraries to effectively communicate the drivers of tax changes to clients.
Ready to enhance your tax analysis? Try Quadratic.