
For many finance professionals and operations managers, the monthly travel expense report is a task that starts deceptively simple but quickly spirals into a logistical nightmare. A single coffee receipt is easy to manage. However, when a consultant returns from a multi-leg international trip with dozens of receipts in three different currencies, split across multiple client project codes, the standard manual process breaks down.
Most professionals facing this complexity immediately look for one of two solutions. They either search for a free travel expense report template excel file, hoping a static spreadsheet can handle the math, or they look toward enterprise-grade solutions like Certify - travel and expense report management software.
The problem is that neither solution fits the specific, dynamic needs of a modern "builder" or analyst. Static templates require too much manual data entry and external calculation, while enterprise software is often rigid, expensive, and overkill for agile teams. There is a better way: building a programmable, flexible workflow in Quadratic. By using a spreadsheet that combines AI, Python, and formulas, you can create a tool that ingests receipts, automates foreign exchange (FX) conversion, and handles complex project allocation automatically.
Why Static Travel Expense Report Templates Fail
The limitations of the standard travel expense report template become obvious the moment a trip involves more than one currency or client. While these templates provide a neat structure for data entry, they lack the logic engine required to process modern business travel.
The primary issue is the "logic gap." Standard optical character recognition (OCR) tools or basic spreadsheets can read a receipt and tell you the date and amount. However, they cannot perform the financial logic required for accurate consulting or project-based accounting.
First, there is the issue of currency volatility. If a consultant spends 50 GBP on a client dinner in London, a static Excel template requires the user to manually look up the exchange rate for that specific date and type it in. Second, standard tools struggle with project allocation. If a flight cost needs to be split 60/40 between two different client project codes, a sample travel expense report usually forces the user to create two separate line items manually.
While a downloaded template might look professional, it is ultimately a passive document. It waits for you to do the math. To truly streamline the process, you need a workflow that actively manipulates the data for you.
The workflow: building a programmable expense engine
The solution lies in moving away from static grids and toward a programmable environment. In Quadratic, you can build a workflow that acts as "middleware," sitting between your raw receipts and your final accounting system. This approach gives you the flexibility of a spreadsheet with the power of a custom application.
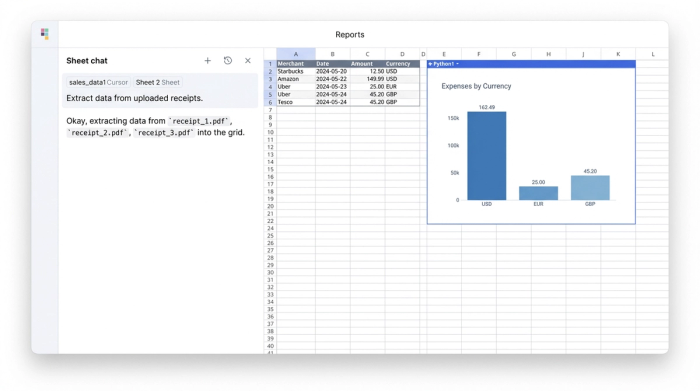
1. Ingestion and extraction (beyond basic OCR)
The first step in this improved workflow is ingestion. Instead of manually typing data into cells, the user uploads itinerary confirmations and receipt PDFs directly into the Quadratic canvas.
Using built-in AI analysis features, the system extracts the core data points: Merchant, Date, Amount, and Currency. Unlike automated travel expense reporting features found in rigid SaaS tools—where this data is often hidden behind a dashboard or uneditable—Quadratic places this data directly into the spreadsheet grid. This gives the analyst immediate visibility and control, allowing them to verify the extraction and make corrections if necessary before any logic is applied.
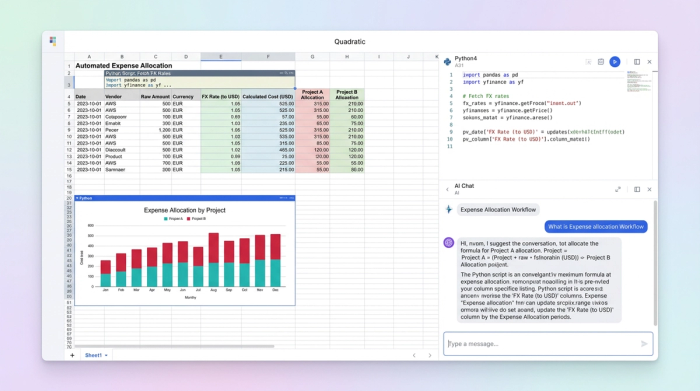
2. The logic layer: real-time FX and allocation
Once the data is in the grid, the real power of the programmable spreadsheet comes into play. This is where you bridge the gap between raw data and a finished report.
For international travel, handling foreign exchange rates is often the biggest bottleneck. In Quadratic, you can use Python directly within the spreadsheet to automate this. Instead of manual lookups, a Python script can read the "Date" and "Currency" columns, fetch the historical exchange rate for that specific day, and calculate the standardized total in your home currency. This ensures that every line item is accurate to the penny based on the day the expense occurred.
Next is project allocation. In a standard travel expense report software, splitting a bill usually involves awkward workarounds. In a programmable workflow, you can define logic that allocates costs based on client codes. You can designate specific expenses as "Billable" or "Non-Billable" or write a formula that splits shared costs (like a rental car used for two client visits) across multiple project columns automatically. This flexibility allows the report to mirror the reality of your business operations, rather than forcing your operations to fit a rigid software template.
3. Policy checks and final reporting
The final stage of the workflow involves automated quality assurance and formatting. Because the data is structured and programmable, you can run automated checks against company policy before the report is ever submitted.
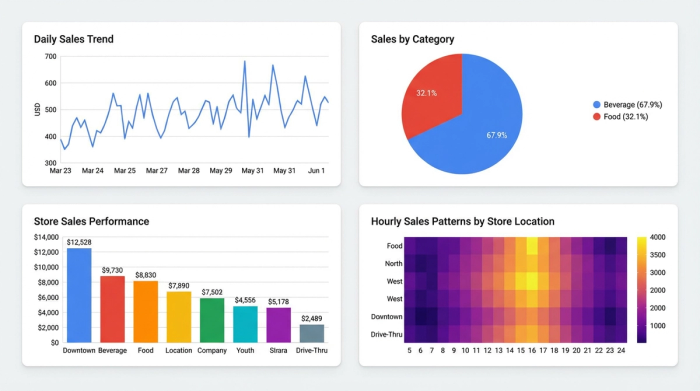
You can set up conditional logic to flag missing receipts, highlight duplicate entries based on timestamps and amounts, or alert the user if a specific category (like "Client Dinner") exceeds a set limit. Finally, the workflow aggregates this data into a clean, formatted travel and expense report. This output sums reimbursable totals by category and project, providing a clear, audit-ready document that can be sent directly to finance for approval.
Benefits of Streamlined Travel Expense Reporting Month-End
Moving from manual entry to a programmable workflow transforms the month-end close process. The most immediate benefit is speed. What used to take days of gathering paper receipts, Googling exchange rates, and manually keying data into a spreadsheet can now be accomplished in minutes.
Beyond speed, the accuracy of the financial data improves significantly. By automating the retrieval of FX rates and the arithmetic of project splits, you eliminate the the "fat finger" errors common in manual data entry.
Perhaps most importantly, building this workflow in Quadratic provides a transparent audit trail. In many "black box" software solutions, it is difficult to see exactly how a total was calculated. In Quadratic, every step—from the raw extracted text to the Python script pulling the currency rate—is visible and traceable. This transparency is invaluable during audits or when reconciling complex client invoices.
Conclusion: from manual entry to automated logic
Finance and operations professionals no longer have to choose between a broken, manual spreadsheet and an expensive, rigid ERP system. There is a middle path that offers the best of both worlds: the flexibility to define your own logic and the power to automate complex tasks.
By treating your expense reporting as a programmable workflow rather than a static data entry task, you can handle foreign currency, complex allocations, and policy compliance with ease. Stop searching for a static travel and expense report template that will only slow you down. Instead, start building a dynamic engine in Quadratic that fits your specific business logic and does the heavy lifting for you.
Try Quadratic, the AI spreadsheet that does your work for you
Use Quadratic to manage travel expense reports
- Automate travel expense report creation by ingesting receipt PDFs and extracting key data (merchant, date, amount, currency) directly into the spreadsheet.
- Eliminate manual foreign exchange lookups with Python scripts that automatically fetch historical rates and convert expenses to your home currency.
- Streamline complex project allocation by defining custom logic to split costs across multiple client codes or designate expenses as billable/non-billable.
- Ensure accuracy and compliance with automated policy checks that flag missing receipts, duplicate entries, or spending limit breaches.
- Gain full transparency into every calculation, from raw data extraction to final totals, providing an audit-ready travel expense report.
Ready to simplify your travel expense reporting? Try Quadratic.