
Table of contents
- The anatomy of a scalable vehicle rental management system
- Step 1: Fleet configuration (the source of truth)
- Step 2: Streamlining operations with a daily transaction form
- Step 3: Financial rigor and asset payment tracking
- Visualizing performance: the monthly overview dashboard
- Automating the grunt work: recovery lists & alerts
- Why Python makes your rental system future-proof
- Conclusion
- Use Quadratic to do vehicle rental management
Managing a fleet is a high-wire act. You aren't just keeping track of keys and mileage; you are balancing asset depreciation, insurance schedules, varying utilization rates, and cash flow. For many small business operations, where small fleet managers often face significant operational challenges, the default solution is a standard spreadsheet. However, the chaos of the vehicle rental management landscape often outpaces the capabilities of a static grid.
The problem usually starts when you download a template. These pre-built Excel sheets act as "black boxes." You input data, and a number comes out, but the logic is often hidden in complex, fragile formula chains. If you try to customize a depreciation schedule or add a new vehicle category, the whole workbook breaks. You are left fighting the tool rather than managing your business.
To scale effectively, you need a connected system—a "glass box" solution where the logic is transparent, the data flows automatically, and you have total control over how metrics are calculated. In this guide, we will walk through how to build a professional-grade workflow using Quadratic. By combining the familiarity of a spreadsheet with the power of a Python spreadsheet, you can create a system that handles operations, financials, and strategy in a single, transparent workspace.
The anatomy of a scalable vehicle rental management system
A robust vehicle rental management system is not just one massive table containing every piece of data. That approach leads to slow performance and scrolling fatigue. Instead, think of your system as "Mission Control," comprised of distinct, interacting components.
In the Quadratic use case we are building, we separate the workflow into three logical stages:
1. Inputs: This includes your static fleet configuration and your dynamic daily transactions.
2. Processing: This is where Python scripts and formulas crunch the numbers for financial tracking and asset valuation.
3. Outputs: These are your dashboards and automated recovery lists that drive decision-making.
By structuring your data this way, you ensure that your operational team can log rentals quickly without accidentally breaking the financial models used by management.
Step 1: Fleet configuration (the source of truth)
Every system needs a solid foundation. In our workflow, this is the "Fleet Config" sheet. This sheet acts as the central database for every asset you own, providing the foundation for robust inventory analytics. It holds the license plate numbers, VINs, make, model, purchase dates, and baseline rental pricing.
The critical element here is a robust approach to data validation. In a standard spreadsheet, a rushed employee might type "Toyta" instead of "Toyota" or "Ford" instead of "Ford." These small typos wreak havoc later when you try to run pivot tables or financial reports.
In Quadratic, we set strict validation rules. When you configure the fleet, you define the exact spelling and categorization for each vehicle. This ensures that the data flowing into your daily logs is clean from the start. This "source of truth" sheet becomes the reference point for every other calculation in the workbook, preventing the data drift that plagues manual templates.
Step 2: Streamlining operations with a daily transaction form
The operational heart of your business is the "Daily Transaction Entry" sheet. This is where the rubber meets the road—literally. When a customer stands at the counter, your team needs to log the check-out or check-in immediately. They cannot afford to wade through complex tabs to find the right cell.
We design this sheet for speed and accuracy. Using the data from your Fleet Config sheet, we can automate much of the entry process. For example, when a rental agent selects a vehicle ID from a dropdown menu, Quadratic can use a simple Python script or formula to instantly pull the correct daily rate, insurance cost, and vehicle status.
This automation reduces the cognitive load on your staff. They simply log the dates and the customer details, and the system handles the pricing logic in the background. Because Quadratic supports Python directly in the grid, you can even program complex pricing rules—such as weekend surcharges or long-term discounts—that would be incredibly difficult to maintain with standard spreadsheet formulas.
Step 3: Financial rigor and asset payment tracking
Many rental businesses fail to track the true cost of ownership. They focus on revenue but lose sight of the fact that vehicles are liabilities before they are assets. To solve this, we build a dedicated "Asset Payment Tracking" sheet.
This section provides the financial rigor required to understand ROI per vehicle. You need to track monthly financing payments, insurance premiums, and, most importantly, a clear understanding of asset depreciation.
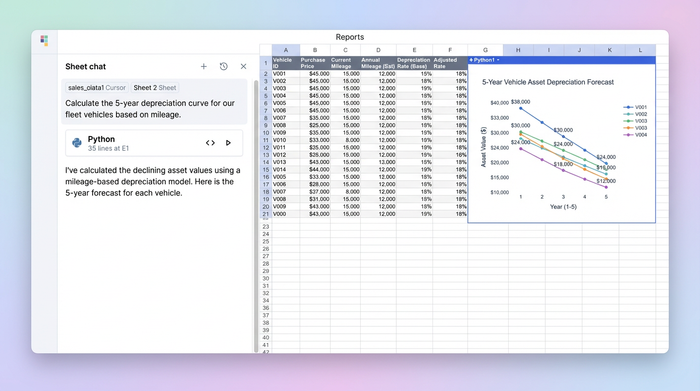
In a traditional spreadsheet, calculating accurate depreciation curves often requires nested IF statements that span several lines. It is messy and prone to errors. In Quadratic, you can use Python libraries to calculate precise aircraft values over time based on mileage or age. You can script a logic flow that says, "If the vehicle is over 50,000 miles, increase the depreciation rate by X%."
It turns a guessing game into a precise financial model, enabling advanced predictive modeling and analytics.
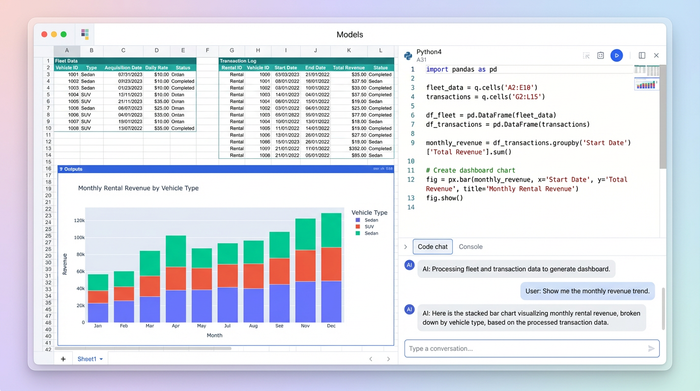
Visualizing performance: the monthly overview dashboard
Once your data is structured and processed, you need to visualize it. The "Monthly Overview" dashboard serves as your executive summary. Because Quadratic is a "glass box," you aren't stuck with the rigid, pre-baked charts found in downloaded templates. You can build visualizations that reflect the metrics you actually care about.
The two most critical fleet performance metrics for this dashboard are generally:
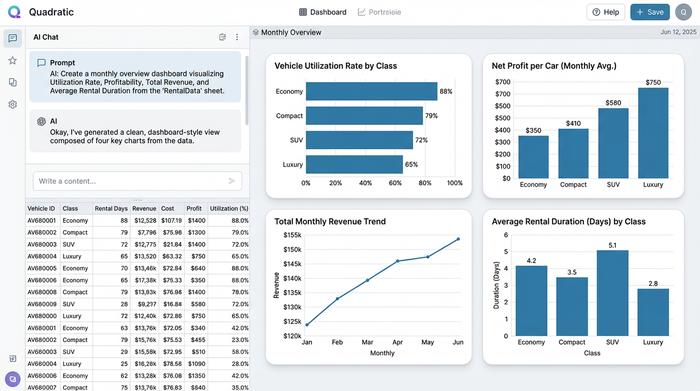
1. Utilization Rate: This calculates the percentage of time a vehicle is renting versus sitting idle. A clear bar chart can show you utilization by vehicle class, helping you with EV fleet selection when deciding whether to buy more SUVs or more economy sedans.
2. Product profitability analysis: By pulling data from the transaction log and the asset payment tracker, you can visualize net profit per car.
Because these charts are powered by Python, they update dynamically as new data enters the system. If you want to change the timeframe from "Last 30 Days" to "Year to Date," you simply tweak the code block, and the visualization adjusts instantly.
Automating the grunt work: recovery lists & alerts
One of the most tedious parts of vehicle rental manager jobs is chasing down overdue returns or missed payments. It is administrative grunt work that eats up valuable time.
In our Quadratic workflow, we automate this using a "Recovery List." The system scans the Daily Transaction data in real-time. If a vehicle's "Expected Return Date" has passed and the "Check-In" field is still empty, the system automatically flags that row.
We can use conditional formatting to turn these rows red and populate a separate "To-Do" list for your recovery team. This ensures that no overdue vehicle slips through the cracks. Instead of manually auditing the list every morning, the rental manager opens the sheet and immediately sees which customers need to be contacted. This moves the workflow from reactive to proactive.
Why Python makes your rental system future-proof
The limitations of standard spreadsheets become obvious as your business grows. A workbook might handle 50 cars fine, but what happens when you have 500 cars and five years of historical data? Traditional sheets start to lag, crash, or corrupt.
Because it allows for Python-powered logic, leveraging the widely recognized benefits of Python for business automation, it processes large datasets much more efficiently than standard formula engines. You can load years of rental history or telematics data without the system slowing down.
Furthermore, the "Glass Box" nature of Quadratic means your business logic is future-proof. You aren't relying on a hidden macro written by a consultant three years ago. The logic is written in readable code that you or your data team can inspect, understand, and improve. If you eventually want to integrate external data—like importing CSV bank statements for reconciliation or connecting to a GPS API—Quadratic provides the technical foundation to make that possible.
Conclusion
A vehicle rental business lives and dies by its margins. To succeed, you need a system that tracks every dollar and every mile with precision. Relying on rigid, black-box templates leaves you blind to the financial realities of your fleet.
By building your vehicle rental management workflow in Quadratic, you gain the flexibility of a spreadsheet with the power of a custom application. You get clean data, automated operations, and financial transparency. Stop fighting with fragile formulas and start building a system that scales with your fleet. You can clone this Quadratic use case today to start with a professional-grade foundation that is ready for you to customize.
Use Quadratic to do vehicle rental management
- Manage your entire fleet with a transparent, "glass box" system combining familiar spreadsheet functions with powerful Python logic.
- Ensure data accuracy from the start with strict validation rules in your central fleet configuration, preventing costly typos and inconsistencies.
- Streamline daily operations by automating rental pricing, vehicle status, and complex discount rules directly within the transaction sheet.
- Gain precise financial rigor by using Python to model accurate depreciation curves and track the true cost of ownership per asset.
- Visualize key performance metrics like utilization rates and net profit per vehicle with dynamic, customizable dashboards.
- Automate administrative tasks such as generating recovery lists for overdue rentals, shifting from reactive to proactive management.
- Future-proof your system with Python's efficiency for large datasets and transparent, auditable business logic.
Ready to build a scalable, transparent system for your fleet? Try Quadratic.