A spreadsheet-based OpenBB alternative
Stock market analysis in a spreadsheet, not a terminal
OpenBB is powerful for developers who want terminal-level access to financial data. Quadratic gives you the same depth of analysis inside the spreadsheet interface you already know — with AI and Python built in.
You already know how to use a spreadsheet
That's the point. OpenBB asks you to learn a new interface — terminal commands, SDK syntax, notebook workflows. Quadratic starts where you are: a spreadsheet grid with rows, columns, and cells. Then it adds the power tools — AI, Python, live data, charts — without taking away the interface you've used for years.
Python power without the Python setup
Both Quadratic and OpenBB give you Python for financial analysis. The difference is where it runs. In Quadratic, Python lives inside spreadsheet cells — write code, reference cell data, output results back to the grid. No virtual environments, no package installs, no switching between tools.
Why analysts choose spreadsheets over terminals
Quadratic gives you everything you need for stock market research in the format that finance teams actually work in — the spreadsheet.
The spreadsheet you already know
No new interface to learn. Quadratic is a real spreadsheet — rows, columns, cells, formulas. All the muscle memory you have from Excel and Google Sheets carries over, and Python and AI are layered on top.
AI that speaks your language
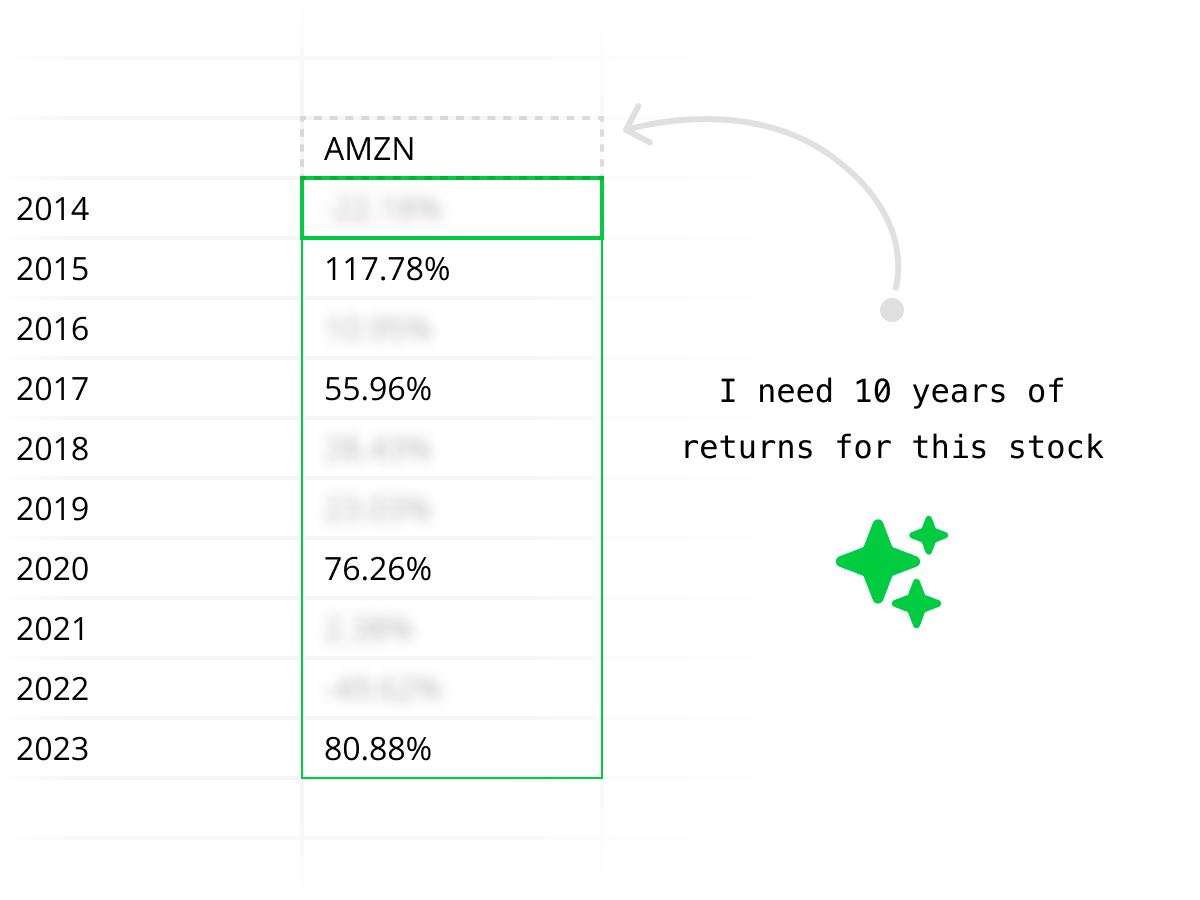
Ask questions in plain English — "Pull 6 months of AAPL prices" or "Compare margins for MSFT and GOOG" — and Quadratic's AI fetches data and writes Python for you. No terminal commands to memorize.
Python without leaving the grid
Write Python directly in spreadsheet cells. Data flows between Python and formulas naturally — reference cell values in code and output results back to the grid. No context switching between IDE and spreadsheet.
Zero setup, zero install
Quadratic runs in your browser. No downloading packages, no managing environments, no configuring API keys for built-in data. Open a spreadsheet and start analyzing.
Real-time collaboration
Share your analysis with teammates and work together in real time — like Google Sheets, but with Python and built-in market data. No exporting, no screen sharing, no syncing files.
Formulas and Python together
Use VLOOKUP, SUMIF, and STOCKHISTORY alongside pandas and numpy in the same file. Quadratic is the only tool that lets spreadsheet formulas and Python code reference each other seamlessly.
The same task, two workflows
See how pulling and analyzing stock data compares between Quadratic and OpenBB.
Open a spreadsheet
Browser-based, nothing to install
Ask AI for data
"Pull 12 months of AAPL prices and calculate RSI"
Data arrives in your grid
Structured, labeled, ready to chart or model
Install the platform
Download, configure Python environment
Set up data providers
Register for API keys, configure credentials
Write SDK code or terminal commands
Learn the command syntax and data structures
Export or visualize in a notebook
Move data to a spreadsheet for modeling
AI-powered financial data analysis
Ask questions like "Compare NVIDIA and AMD margins over the last 4 quarters" and get structured data, Python analysis, and charts — all generated inside your spreadsheet by AI. No terminal commands to learn.

Enterprise security and compliance
Quadratic is SOC 2 and HIPAA compliant with support for self-hosting. Run your financial analysis workflows with the same security standards your firm requires — something most open-source terminals can't offer out of the box.
Explore every kind of market data
From historical prices to live quotes, financials to macro — all the market data you need, directly in your spreadsheet.
Historical stock prices
Pull daily, weekly, or intraday OHLCV data for any publicly traded stock. Backtest strategies, compare tickers, and analyze price trends over any time horizon.
| # | Date | Open | High | Low | Close | Volume |
|---|---|---|---|---|---|---|
| 1 | 2025-06-09 | 244.12 | 246.89 | 243.50 | 245.67 | 58,312,400 |
| 2 | 2025-06-06 | 242.35 | 244.80 | 241.90 | 244.12 | 62,187,200 |
| 3 | 2025-06-05 | 240.78 | 243.15 | 240.10 | 242.35 | 55,843,600 |
| 4 | 2025-06-04 | 238.90 | 241.50 | 238.25 | 240.78 | 49,721,800 |
| 5 | 2025-06-03 | 237.45 | 239.80 | 236.90 | 238.90 | 51,456,300 |
| 6 | 2025-06-02 | 235.20 | 238.10 | 234.85 | 237.45 | 53,892,100 |
| 7 | 2025-05-30 | 233.60 | 236.25 | 233.10 | 235.20 | 47,218,500 |
| 8 | 2025-05-29 | 231.85 | 234.40 | 231.20 | 233.60 | 44,567,900 |
Ready to analyze stocks in a spreadsheet?
Quadratic vs OpenBB feature comparison
Both tools are built for serious financial analysis. The question is whether you want to work in a spreadsheet or a terminal.
| Feature | Quadratic | OpenBB |
|---|---|---|
| Interface | Familiar spreadsheet grid — rows, columns, cells | Terminal / CLI and notebook-style interface |
| Learning curve | If you know spreadsheets, you can start immediately | Requires learning terminal commands and SDK |
| AI assistance | Built-in AI writes Python and fetches data from plain English | AI copilot available but primarily code-oriented |
| Python | Runs natively inside spreadsheet cells with full library access | Python SDK for notebooks and scripts |
| Data access | Built-in market data APIs — no keys or setup needed | Extensive data provider integrations, many require API keys |
| Collaboration | Real-time multiplayer spreadsheet with sharing and permissions | Individual workspace, share via export |
| Formulas | Full spreadsheet formulas (SUM, VLOOKUP, STOCKHISTORY, etc.) | No spreadsheet formulas — code only |
| Visualization | Built-in charts from cells or Python-generated plots | Charts via terminal or Python plotting libraries |
| Target user | Investors and analysts who think in spreadsheets | Developers and quants comfortable with terminals |
| Deployment | Browser-based, nothing to install | Local install or cloud platform |
Which tool is right for you?
Choose Quadratic if you…
- Think in rows, columns, and cells
- Want AI to write Python and fetch data for you
- Need to share analysis with non-technical teammates
- Want to start analyzing immediately with zero setup
- Need enterprise security and compliance
Choose OpenBB if you…
- Are a developer comfortable in terminals and notebooks
- Need access to niche or specialized data vendors
- Want to build fully custom pipelines from scratch
- Prefer working in Jupyter notebooks over spreadsheets
Quadratic vs OpenBB FAQ
How is Quadratic different from OpenBB?
Quadratic is an OpenBB alternative built around a spreadsheet interface with Python, AI, and market data built in. OpenBB is a research terminal and SDK designed for developers and quants. The core difference is the workflow: Quadratic lets you analyze stocks in the rows-and-columns grid you already know, while OpenBB requires learning a terminal or SDK. If you think in spreadsheets, Quadratic is the faster path to analysis.
Can Quadratic do everything OpenBB does?
For most stock market analysis workflows — pulling prices, comparing fundamentals, running technical studies, building models — yes. Quadratic handles these in a spreadsheet with AI, Python, and built-in data. OpenBB has deeper integrations with niche data vendors and more granular terminal-level access, which matters most for quant developers building custom pipelines.
Do I need to know Python to use Quadratic?
No. You can use Quadratic with just spreadsheet formulas and AI prompts in plain English. The AI writes Python for you when needed. With OpenBB, Python or terminal commands are the primary way to interact with data.
Which is better for financial statement analysis?
If you want to pull income statements, balance sheets, and cash flow data and immediately model them in a spreadsheet, Quadratic is the faster workflow. Ask AI for the data, and it arrives in your grid ready to manipulate with formulas or Python. OpenBB can pull the same data, but you work with it in notebooks or terminal output rather than a spreadsheet.
Can I use Quadratic for technical analysis?
Yes. Quadratic supports technical indicators like RSI, MACD, Bollinger Bands, and moving averages through AI-generated Python or your own code. You can layer indicators directly onto price data in the same spreadsheet, with charts built in.
Is Quadratic free?
Quadratic has a free tier that includes AI, Python, spreadsheet formulas, built-in data connections, and charting. OpenBB has a free open-source terminal, with paid plans for their platform and some data providers.
Can I share my analysis with others?
Yes. Quadratic spreadsheets are shareable by link with real-time collaboration — like Google Sheets but with Python and market data. OpenBB workspaces are local or individual by default and typically shared by exporting results.
Which tool is better for portfolio tracking?
Quadratic is purpose-built for it. A spreadsheet is the natural format for tracking holdings, calculating allocations, monitoring performance, and comparing returns across assets. You can pull live data, run Python analysis, and keep everything in one shareable file.