Quadratic vs Stock Market Plugins
Stop paying for plugins that only get data into cells
MarketXLS, Wisesheets, SheetsFinance — stock data add-ons get you halfway there. Quadratic gives you the data, Python for analysis, AI for automation, and charts for visualization. All built in. No plugins.
The problem with stock market plugins
Add-ons for Excel and Google Sheets were built when getting data into a spreadsheet was the hard part. Today, the hard part is analyzing it — and plugins don't help with that.
Subscription on top of a subscription
Most stock market plugins charge $20–50/month on top of your existing Excel or Google Sheets cost. Quadratic includes stock data access, AI, and Python in its free tier — no extra subscriptions for data.
Rate limits and quotas
Stock data add-ons typically cap how many API calls you can make per day or month. Pull data for 50 tickers and you might hit your limit before lunch. Quadratic doesn't impose per-query rate limits on built-in data.
Data in, analysis out (of the spreadsheet)
Plugins solve one problem — getting data into cells. But the analysis still has to happen with basic spreadsheet formulas. Quadratic gives you Python, AI, and formulas in one workflow so you can go from data to insight without switching tools.
Plugin compatibility headaches
Add-ons break with updates, conflict with other plugins, and have varying support across Excel versions and platforms. Quadratic is a single, integrated tool — nothing to install, nothing to keep updated.
Limited to the data they offer
Each plugin gives you access to a specific set of endpoints and data fields. Need something outside their coverage? You're stuck. Quadratic lets you call any REST API with Python, so you're never limited to one vendor's data catalog.
No AI, no automation
Stock data plugins don't write analysis for you. You still have to know which formulas to use and build everything manually. Quadratic's AI generates Python, fetches data, and builds analysis from a plain English prompt.
One spreadsheet replaces your entire plugin stack
Instead of installing a data plugin, a charting plugin, and exporting to Python separately — Quadratic puts everything in one place.
Ask AI or use a formula
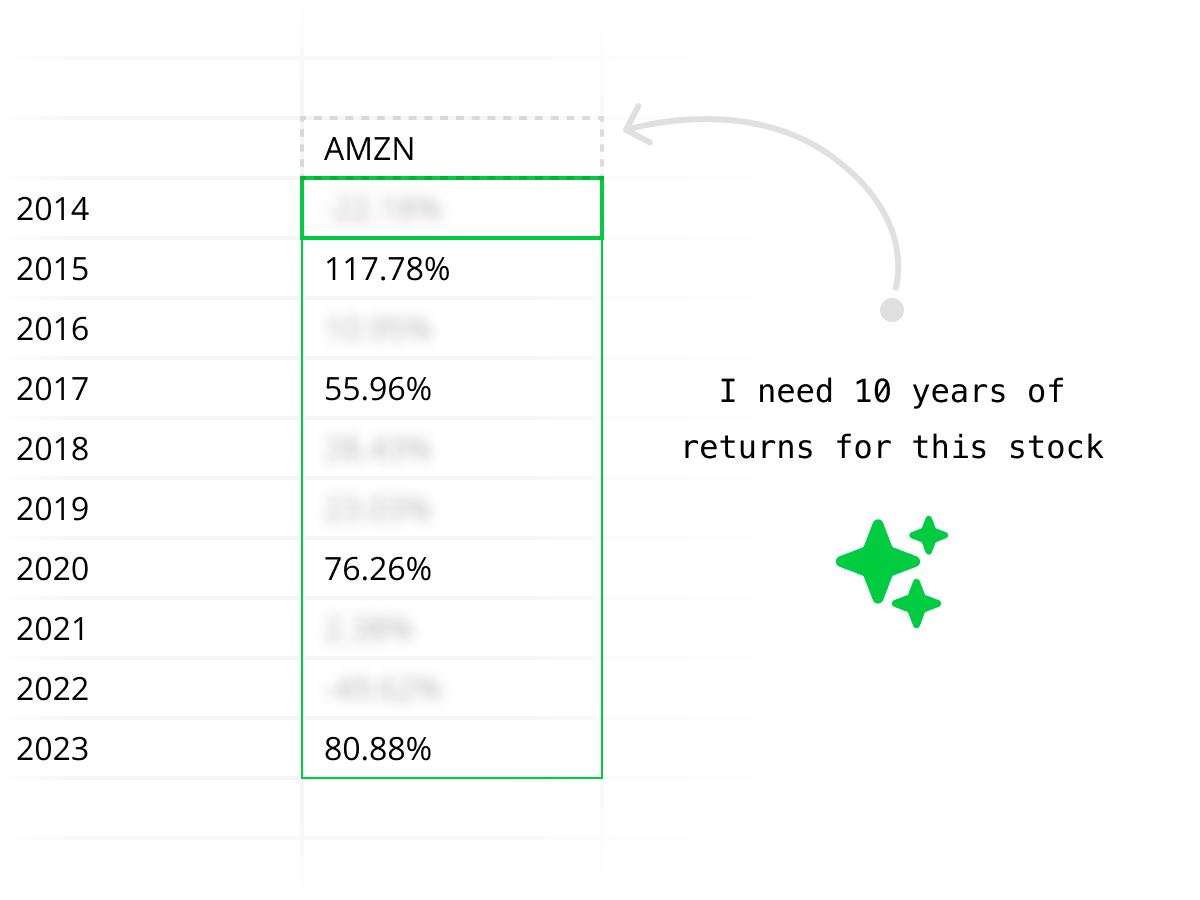
Type "Pull 6 months of NVDA daily prices and quarterly revenue" or use the STOCKHISTORY formula. Data arrives structured in your grid — no plugin, no API key, no rate limit.
Use Python right in the sheet
Calculate returns, run regressions, build screens, compute technical indicators — with pandas, numpy, and any Python library, directly in spreadsheet cells. No external IDE needed.
Chart and share instantly
Build charts from your data, share the spreadsheet with teammates in real time, and come back tomorrow to refresh everything with one click. No exporting, no rebuilding.
How Quadratic compares to popular stock data plugins
Each plugin solves a piece of the puzzle. Quadratic solves the whole thing.
MarketXLS
Excel add-in for real-time and historical stock data, options, and fundamentals.
Excel-only, paid plans starting ~$30/month, no Python or AI analysis.
Wisesheets
Stock and crypto data for Excel and Google Sheets via custom formulas.
Formula-only workflow, rate limits on free tier, paid plans for full access.
SheetsFinance
Google Sheets add-on for stock quotes, financials, and screening.
Google Sheets only, limited free tier, no Python or programmatic analysis.
Stock Connector
Simple real-time stock data add-on for Google Sheets.
Basic quotes only, no historical data depth, no analysis tools.
Intrinio / Quandl formulas
Professional-grade financial data via Excel or Sheets formulas.
Expensive API plans, complex setup, data access only — analysis is separate.
AI replaces manual data lookups
Instead of memorizing plugin-specific formula syntax like =MSFT_REVENUE() or =WS("AAPL","price"), just ask Quadratic in plain English. The AI figures out which API to call, writes the code, and delivers structured results to your grid.

Enterprise security without plugin risk
Every plugin you install is a third-party dependency with access to your spreadsheet data. Quadratic is SOC 2 and HIPAA compliant with self-hosting options — giving you one trusted tool instead of a chain of plugin vendors.
Explore every kind of market data
From historical prices to live quotes, financials to macro — all the market data you need, directly in your spreadsheet.
Historical stock prices
Pull daily, weekly, or intraday OHLCV data for any publicly traded stock. Backtest strategies, compare tickers, and analyze price trends over any time horizon.
| # | Date | Open | High | Low | Close | Volume |
|---|---|---|---|---|---|---|
| 1 | 2025-06-09 | 244.12 | 246.89 | 243.50 | 245.67 | 58,312,400 |
| 2 | 2025-06-06 | 242.35 | 244.80 | 241.90 | 244.12 | 62,187,200 |
| 3 | 2025-06-05 | 240.78 | 243.15 | 240.10 | 242.35 | 55,843,600 |
| 4 | 2025-06-04 | 238.90 | 241.50 | 238.25 | 240.78 | 49,721,800 |
| 5 | 2025-06-03 | 237.45 | 239.80 | 236.90 | 238.90 | 51,456,300 |
| 6 | 2025-06-02 | 235.20 | 238.10 | 234.85 | 237.45 | 53,892,100 |
| 7 | 2025-05-30 | 233.60 | 236.25 | 233.10 | 235.20 | 47,218,500 |
| 8 | 2025-05-29 | 231.85 | 234.40 | 231.20 | 233.60 | 44,567,900 |
Replace your stock data plugins with one spreadsheet.
Quadratic vs stock market plugins: full comparison
Plugins get data into cells. Quadratic gets you from question to answer.
| Capability | Quadratic | Stock data plugins |
|---|---|---|
| Cost for stock data | Free tier includes built-in data access | $20–50/month per plugin, often tiered by usage |
| Setup | Open a spreadsheet and start | Install plugin, create account, configure API keys |
| Data access method | AI prompts, STOCKHISTORY formula, or Python | Custom formulas specific to each plugin |
| Rate limits | No per-query limits on built-in data | Typically 100–500 calls/day depending on plan |
| Financial statements | AI pulls income statements, balance sheets, cash flow | Available on some plugins, often on higher-tier plans |
| Technical analysis | Python-generated indicators, AI-built analysis | Data only — you build the indicators with formulas |
| Python | Built-in, runs in spreadsheet cells | Not available — formula-based only |
| AI assistance | Generates Python, fetches data, builds charts from English | None |
| Data extensibility | Call any REST API via Python + 50+ built-in connections | Limited to the plugin vendor's data catalog |
| Compatibility | Browser-based, works everywhere | Varies by Excel version, platform, and Sheets support |
Built for every type of investor
Whether you're tracking a portfolio, screening for value stocks, or running technical analysis, Quadratic replaces the plugin with a complete workflow.
If you use plugins for portfolio tracking
Stop refreshing formulas that break. Quadratic pulls live prices, calculates allocations, tracks performance, and builds charts — with AI handling the data fetching so you focus on decisions.
If you use plugins for stock screening
Go beyond what plugin formulas can express. Use Python to build multi-factor screens with custom logic, weight signals, and rank stocks — all in the same spreadsheet where you track results.
If you use plugins for fundamental analysis
Pull complete financial statements with one AI prompt instead of writing dozens of plugin formulas. Quadratic gives you income statements, balance sheets, and cash flow data — structured and ready to model.
If you use plugins for technical analysis
Plugins give you price data. You still have to build every indicator with formulas. Quadratic's AI generates Python-powered RSI, MACD, Bollinger Bands, and moving averages — complete with charts.
Stock market plugins FAQ
Why use Quadratic instead of a stock market plugin?
Plugins solve one problem: getting stock data into spreadsheet cells. Quadratic solves the whole workflow — data access, analysis with Python, AI-generated insights, and visualization — all in one tool. No plugins to install, no extra subscriptions, no rate limits on built-in data.
Is Quadratic more expensive than stock market add-ons?
No. Quadratic's free tier includes stock data access, Python, AI, and charting. Most stock market plugins charge $20–50/month for data access alone, on top of your existing Excel or Google Sheets costs. Quadratic is typically less expensive and more capable.
Is Quadratic a MarketXLS, WiseSheets, or SheetsFinance alternative?
Yes. Quadratic is a stock market plugin alternative for users who want more than data formulas. You can pull historical prices, real-time quotes, financial statements, fundamentals, technical indicators, options data, and more with AI prompts, STOCKHISTORY, or Python. Instead of adding MarketXLS, WiseSheets, or SheetsFinance to Excel or Google Sheets, Quadratic gives you market data, Python, AI, charts, and dashboards in one spreadsheet.
Do I need to learn new formulas?
Quadratic uses standard spreadsheet formulas you already know (SUM, VLOOKUP, IF, etc.) plus STOCKHISTORY for built-in stock data. But you can also skip formulas entirely and ask AI in plain English to pull and analyze data for you.
What if I need data that Quadratic doesn't have built in?
Use Python in Quadratic to call any REST API — your own data providers, premium vendors, or custom endpoints. Unlike plugins that lock you into their data catalog, Quadratic gives you programmatic access to anything with an API.
Can I use Quadratic with my existing Excel or Google Sheets files?
You can import CSV and Excel files into Quadratic and immediately enhance them with Python, AI, and built-in data connections. Your existing spreadsheet knowledge transfers directly.
How does Quadratic handle real-time stock data vs plugins?
Quadratic provides real-time stock quotes through built-in data access — no API key setup or rate limit management required. Many plugins throttle real-time data or require higher-tier plans for live quotes.
Is Quadratic secure enough for financial data?
Yes. Quadratic is SOC 2 and HIPAA compliant, with self-hosting available for enterprises. Most stock data plugins don't offer the same level of security certification or deployment flexibility.