Overview of the polynomial root calculator template
This template provides a robust environment for solving high-degree polynomial equations within the coding spreadsheet grid. It utilizes Python to automatically compute solutions and generate interactive visualizations, allowing users to explore mathematical behaviors without writing code.
- Solves for roots of polynomials up to degree 19.
- Calculates both real and complex roots automatically using
numpy. - Visualizes the polynomial curve and root positions in the complex plane.
- Leverages Python libraries for data visualization for immediate, reactive recalculation upon input changes.
Input sections and configuration
Coefficient entry
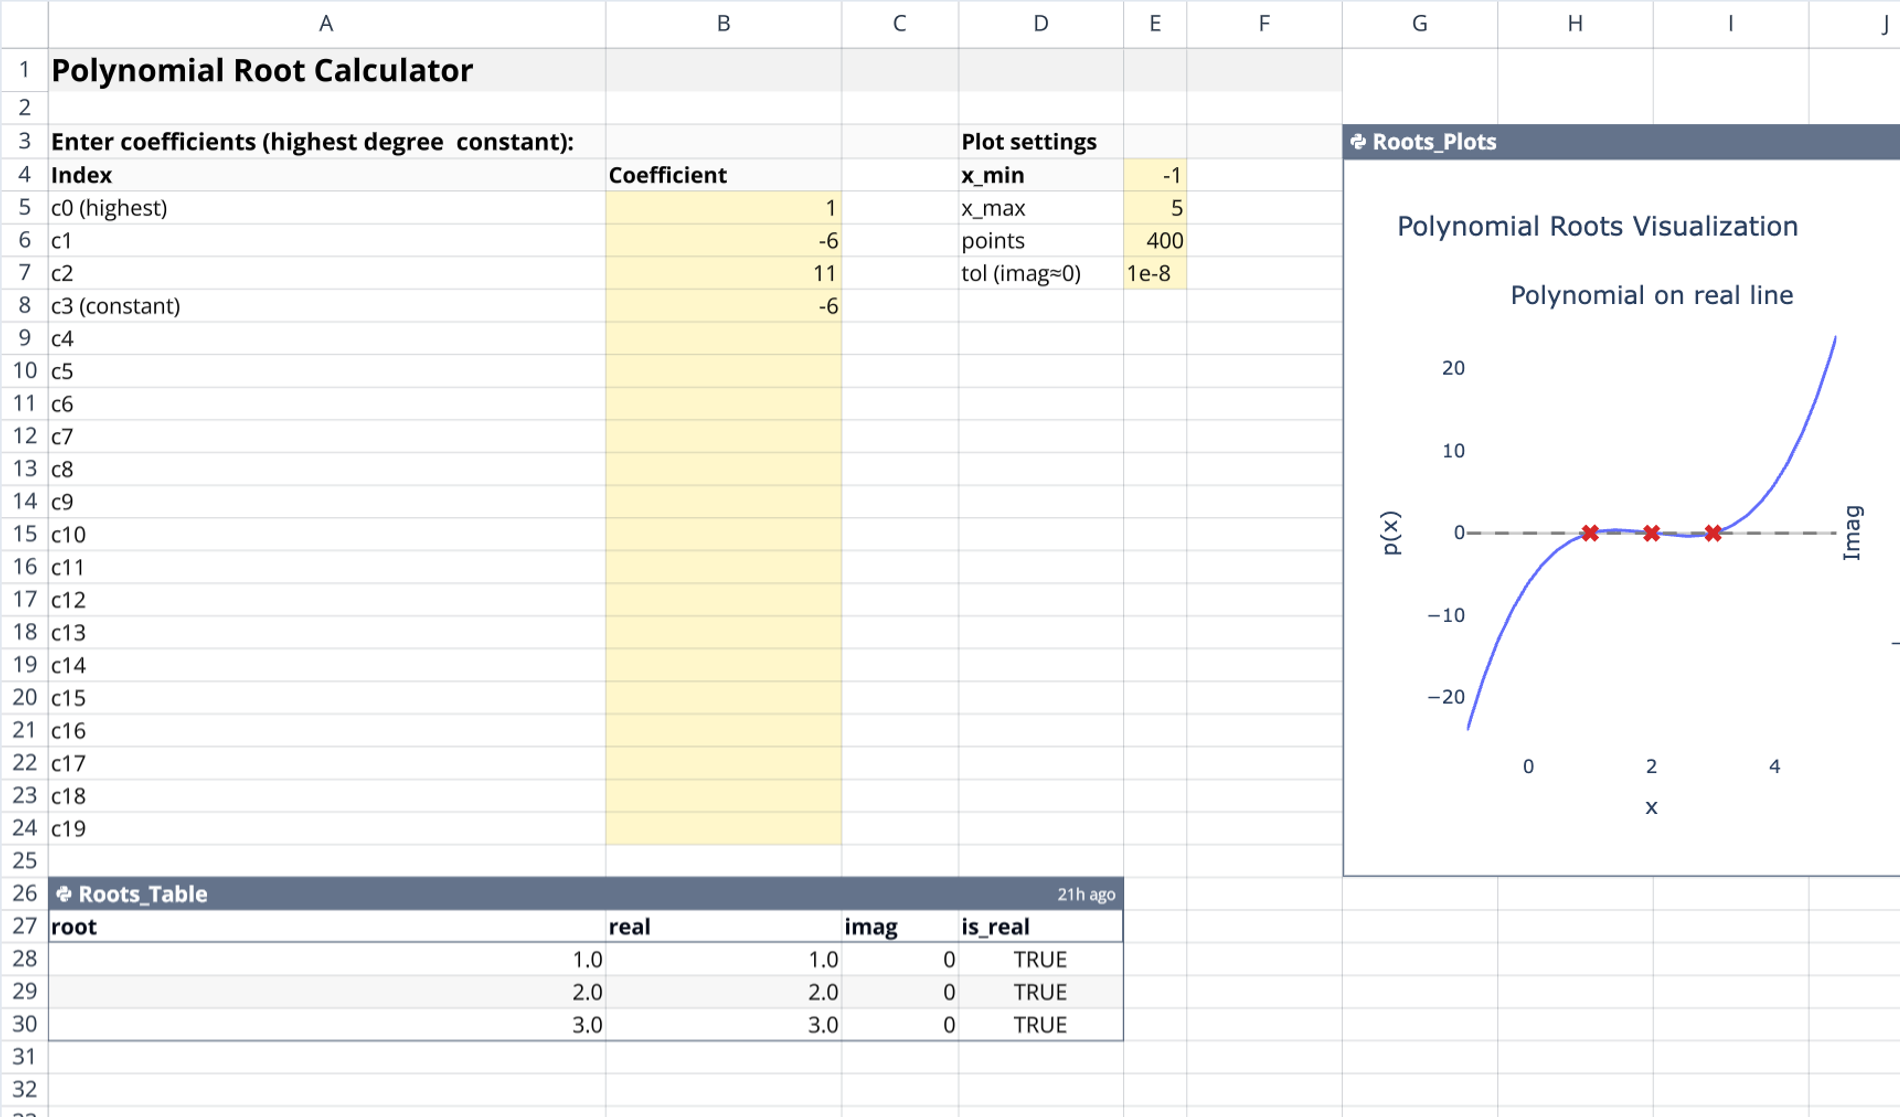
The primary input area is located in columns A and B. Column A contains labels ranging from c0 to c19. c0 represents the highest-degree term in the equation. Users define the polynomial by entering numeric values into column B next to the corresponding labels.
Plot settings parameters
Configuration parameters are found in columns D and E. These settings control the visualization behavior and calculation precision:
- x_min and x_max: Define the horizontal range for the function graph.
- points: Controls the resolution and smoothness of the generated curve.
- tol: Sets the tolerance threshold for classifying roots as real versus complex.
Calculation logic and output components
Roots table generation
The calculation is performed by the Python cell Roots_Table, anchored at cell A26. This script ingests the coefficients and strips leading zeros to identify the correct degree before employing numpy.roots to find solutions. It returns a pandas DataFrame containing:
- The raw root value.
- Separated real and imaginary parts.
- A boolean check indicating if the root is considered real.
- Output sorted to display real roots first.
Visualization with Plotly
The Roots_Plots Python cell, anchored at G3, functions as a python chart generator, producing a two-panel interactive chart.
- Left panel: Plots the polynomial curve over the defined x-range, marking real roots (x-intercepts) with red X markers.
- Right panel: Maps all roots onto the complex plane, plotting real components against imaginary components.
How to use the roots of polynomial calculator
To utilize the python template effectively:
- Enter coefficient values in column B corresponding to the specific polynomial terms.
- Adjust
x_minandx_maxto focus the graph on the relevant domain. - Modify the
tolparameter if very small imaginary parts should be treated as zero. - View the
Roots_Tablestarting at A26 for precise numerical data and classification. - Analyze the
Roots_Plotsvisualization for a geometric interpretation of the function and its solutions.
Who this Polynomial Root Calculator is for
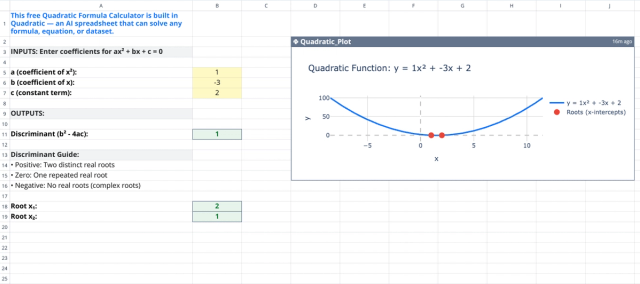
- Algebra and calculus students studying polynomial behavior, including quadratic equations.
- Educators demonstrating the relationship between coefficients and roots.
- Engineers needing quick solutions for characteristic equations.
- Analysts requiring a customizable root of polynomial calculator within a python spreadsheet interface.
Use Quadratic to calculate and visualize polynomial roots
- Input polynomial coefficients directly in the spreadsheet grid.
- Automatically compute real and complex roots for polynomials up to degree 19 using Python.
- Generate interactive plots showing the polynomial curve and root positions in the complex plane.
- Adjust plot ranges and root tolerance directly in the grid to refine visualizations.
- Instantly update root calculations and graphs as you modify input values.
- View a structured table of roots, including real and imaginary parts, for precise numerical analysis.