
Table of contents
- The core difference: gross margin vs. net profit margin
- Why static models fail at margin analysis
- Step 1: Automating data ingestion for granular analysis
- Step 2: Calculating net margin with dynamic cost allocation
- Step 3: Building the "margin bridge" (variance analysis)
- Step 4: Automating the variance narrative
- Conclusion: From calculation to insight
Every financial analyst knows the theoretical difference between gross and net margin. The definitions are standard accounting 101. However, the real challenge for FP&A teams isn't defining the terms—it is the execution of the monthly analysis. Accurately allocating shared costs to specific product lines and explaining the "why" behind variance in a static spreadsheet is often a manual, error-prone process.
To satisfy the immediate definition: the difference between gross margin vs net margin is the scope of costs included. Gross margin measures direct production efficiency (Revenue minus Cost of Goods Sold), while net margin measures the bottom-line profitability after all operating expenses, interest, and taxes are deducted.
The problem arises when businesses try to model these metrics at a granular level. Traditional analysis often fails because data is static, cost allocation rules are difficult to maintain in cell-based formulas, and analysts spend days manually writing variance narratives. This article explores a modern workflow using Quadratic. By importing granular data directly and using Python for complex allocations, analysts can automate spreadsheets for the calculation and explanation of these critical metrics.
The core difference: gross margin vs. net profit margin
Before diving into the automated workflow, it is essential to establish the foundational formulas and how they differ in scope.
Gross margin is calculated as (Revenue - COGS) / Revenue. This metric looks strictly at the direct costs associated with producing goods or services. It is a measure of production efficiency and pricing power. If this number drops, it usually indicates rising material costs or inefficient labor usage.
Net margin is calculated as (Revenue - COGS - Operating Expenses - Interest - Taxes) / Revenue. This is the comprehensive view of business health. It accounts for the overhead required to run the company, such as rent, marketing, administrative salaries, and debt service.
When comparing gross profit margin vs net profit margin, the distinction for P&L analysis lies in what they reveal about the business:
- Scope: Gross margin is often product-specific, while net margin is typically company-wide (unless complex allocations are used).
- Drivers: Gross margin is driven by material costs and unit pricing. Net margin is driven by overhead management and administrative efficiency.
- Decision Making: Managers look at gross vs net profit margin differently. Gross margin informs pricing strategies and supplier negotiations, while net margin informs budgeting for headcount, expansion, and capital expenditures.
Understanding whether to optimize for gross or net income depends on the company's stage of growth, but a mature analysis requires visibility into both.
Why static models fail at margin analysis
While the math behind net vs gross profit margin is simple, modeling it accurately across hundreds of SKUs or multiple regions is not. Static spreadsheets present two major hurdles that slow down the monthly close.
The first is the granularity gap. To understand true profitability, analysts need data at the transaction or SKU level. In traditional spreadsheets, this requires exporting large CSV files from an ERP and pasting them into a workbook. This manual process is fragile; if the data exceeds row limits or the export format changes, the model breaks.
The second hurdle is the allocation headache. Calculating a true "Net Margin by Product" requires taking shared operating expenses—like IT support, office rent, or brand marketing—and splitting them across specific products. Doing this with standard spreadsheet formulas results in complex, brittle cell referencing that is difficult to audit. This often forces analysts to abandon product profitability analysis entirely, leaving them with an incomplete picture of profitability.
Step 1: Automating data ingestion for granular analysis
The first step in modernizing this workflow is removing the manual data entry. In a Quadratic workflow, the analyst does not download CSVs. Instead, they connect directly to the company’s database or data warehouse (such as Snowflake, Postgres, or MySQL) using built-in SQL connectors.
By writing a simple SQL query within the spreadsheet, the analyst imports live Revenue and COGS data grouped by product line and month. This ensures that the foundation of the gross margin vs net profit calculation is always based on the most current data. There is no need for manual cleaning or copy-pasting, which eliminates the risk of version control errors.
This direct connection solves the data preparation hurdle. With granular data automatically populated in the grid, the analyst can move immediately to analysis rather than wasting time on data hygiene.
Step 2: Calculating net margin with dynamic cost allocation
Once the revenue and direct costs are ingested, the next challenge is calculating the net figure. This is where the workflow moves beyond simple arithmetic and tackles the complexity of net vs gross profit margin at a granular level. The analyst must bring in Operating Expenses (OpEx) and allocate them logically.
In a traditional sheet, allocating a $500,000 marketing budget across 20 product lines based on their revenue contribution requires a web of SUMIF formulas. In Quadratic, the analyst can use Python to handle this logic.
The analyst can treat the data as a dataframe and write a script to apply allocation rules dynamically. For example:
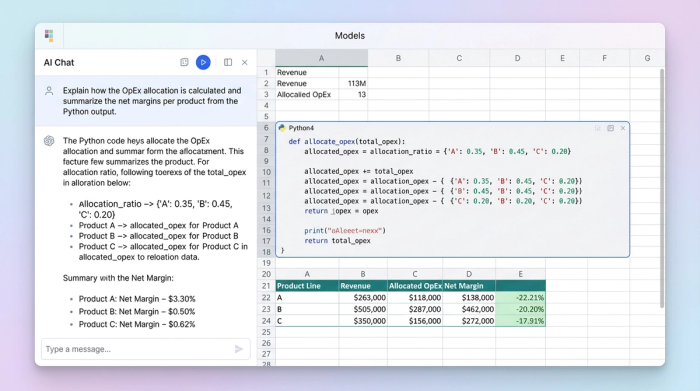
Net Margin = Gross Margin - (Shared_OpEx * Allocation_Rule)
If the allocation rule is "proportional to revenue," Python calculates the ratio for each product and distributes the cost automatically. If the business decides to change the rule next month—perhaps allocating based on headcount instead of revenue—the analyst simply updates a variable in the code, and the entire model recalculates. This flexibility allows finance teams to see the true gross profit margin vs net profit margin breakdown per product without managing fragile formula chains.
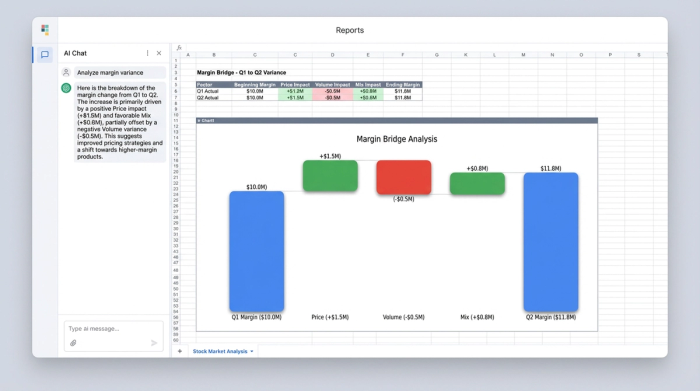
Step 3: Building the "margin bridge" (variance analysis)
With accurate gross and net margins calculated for the current period, the focus shifts to variance analysis. The model must explain the difference between the actual results and the budget (or the prior period). This is often called a "margin bridge."
To effectively analyze gross margin vs net profit variance, the model needs to isolate the drivers of change:
- Price: Did the margin change because the company raised or lowered prices?
- Volume: Did the company sell more units, absorbing fixed costs better?
- Mix: Did the company sell a higher proportion of low-margin products compared to high-margin ones?
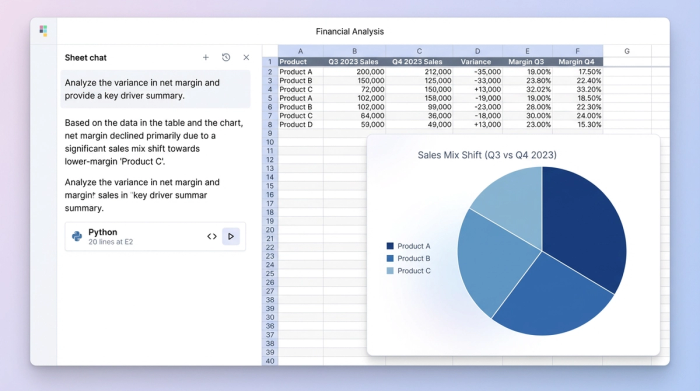
By isolating these variables, the analyst can pinpoint exactly why the numbers moved. For instance, a drop in net margin might not be due to overspending on OpEx, but rather a shift in sales mix toward a product with lower gross margins.
Step 4: Automating the variance narrative
The final and most valuable step in this workflow is automating the explanation. Stakeholders and executives rarely want to look at a raw table of numbers; they want to know the story. Typically, an analyst spends hours writing emails explaining that "Net margin declined due to a mix shift."
In Quadratic, this narrative generation can be automated. Using the calculated variances from the previous steps, the analyst can set up logic or use AI integration to generate the text explanation automatically.
For example, if the model detects that the "Mix" variance is the primary driver of a decrease in gross margin vs net profit, the sheet can output a sentence like: "Net margin declined 2% primarily due to a shift in sales mix toward lower-margin Product B, despite stable operating expenses."
This turns the spreadsheet into a dynamic report. The analyst no longer needs to manually interpret the bridge every month; the logic is embedded in the tool, providing instant, consistent, and accurate narratives that are ready for executive review.
Conclusion: From calculation to insight
Understanding the definition of gross margin vs net profit is only the starting point for financial data analysis. The real value comes from the ability to execute this analysis efficiently and accurately at a granular level.
Static spreadsheets often force analysts to choose between speed and depth, leading to simplified models that miss the nuance of cost allocations and variance drivers. By adopting a dynamic workflow in Quadratic, finance teams can automate data ingestion, handle complex Python-based allocations, and auto-generate the variance narrative. This transforms margin analysis from a manual monthly chore into a strategic asset, giving the business a clear view of true profitability.
For analysts ready to move beyond manual inputs and fragile formulas, building a dynamic margin fp&a model in Quadratic offers a powerful path forward.
Use Quadratic to calculate and explain gross margin vs net margin variances
- Automate granular data ingestion: Connect directly to live databases (like Snowflake or Postgres) with SQL to import revenue and COGS data, eliminating manual exports and data hygiene efforts.
- Dynamically allocate shared costs: Use Python within the spreadsheet to model complex operating expense allocations across product lines, easily updating rules without building fragile cell-based formulas.
- Pinpoint exact variance drivers: Isolate the impact of price, volume, and mix changes to clearly understand the root causes behind gross and net margin shifts.
- Generate automated variance narratives: Set up logic or use AI integration to automatically create clear text explanations for margin variances, turning raw data into executive-ready insights.
Ready to move beyond static spreadsheets? Try Quadratic.