
Table of contents
For the self-employed professional, tax season is often a source of anxiety. It is not just about reporting history; it is about optimizing how much of your hard-earned revenue you actually keep. When you work for yourself, you are the CFO of your own life, and the decisions you make in December can drastically alter the check you write in April.
The problem is that most professionals search for ways to reduce taxable income and find static lists of generic advice, often found in simple personal finance templates. They see suggestions like "buy equipment" or "save for retirement," but they are left guessing at the actual impact. They spend money to save money without knowing if the math works in their favor.
True tax optimization requires moving from listing deductions to modeling scenarios, supported by stronger QuickBooks analytics and financial modeling workflows. Instead of just collecting receipts in a shoebox, successful freelancers and business owners use dynamic tools like Quadratic to visualize how different financial decisions impact their final tax bill. By building a tax scenario model, you can see exactly how a $5,000 equipment purchase or a retirement contribution changes your bottom line before you spend a dime.
Understanding the Math: How to Reduce Your Taxable Income
Before diving into specific strategies, it is essential to understand the formula governing your taxes. Taxable income is not simply the total money you earned. It is your Gross Income minus Above-the-Line Deductions (adjustments to income), minus either the Standard Deduction or Itemized Deductions.
The goal of tax planning isn't to hide income; it is to legally lower your Adjusted Gross Income (AGI). When you lower your Adjusted Gross Income (AGI), you not only pay less tax on that specific amount, but you may also qualify for other credits and deductions that are phased out at higher income levels.
If you are wondering how to reduce your taxable income, the answer lies in identifying which expenses and contributions, such as the tax deduction of medical expenses, can be subtracted from your gross revenue. For the self-employed, this is a math problem with many variables. If you frequently ask yourself, "how can I reduce my taxable income without hurting my cash flow," the solution is to model these variables in a spreadsheet that can handle the complexity of your finances.
Top Strategies to Reduce Taxable Income (and How to Model Them)
There are several standard levers you can pull to lower your tax bill. However, simply knowing they exist isn't enough. You need to know how to apply them to your specific financial situation. Here is how you can take common deductions and model them in Quadratic to make data-backed decisions.
Retirement contributions (401k, SEP IRA, Roth)
Contributing to a retirement account is often the most effective way to lower your AGI because you are paying your future self rather than the IRS. However, the type of account matters significantly.
Do 401k contributions reduce taxable income?
Yes, traditional 401k contributions are made pre-tax, which directly lowers your taxable income for the year in which you contribute. You do not pay taxes on that money until you withdraw it in retirement.
Does Roth IRA reduce taxable income?
No. Roth contributions are made with post-tax dollars. You pay taxes on the income now so that you can withdraw it tax-free in retirement. While beneficial for long-term growth, a Roth contribution will not lower your tax bill for the current year.
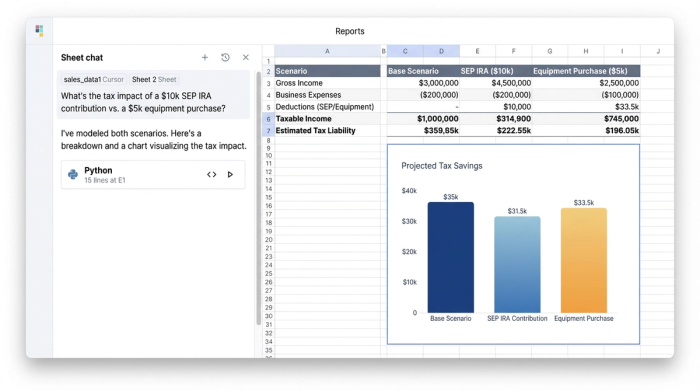
The Quadratic use case
In Quadratic, you can model this trade-off instantly. A user can set up a cell for "Retirement Contribution" and link it to their "Estimated Tax Liability" formula. By toggling the contribution type between "SEP IRA" (pre-tax) and "Roth" (post-tax), the spreadsheet immediately recalculates the estimated quarterly payment. This allows you to answer a critical question: "If I contribute $10,000 to a SEP IRA today, how much cash do I save on taxes in April?"
Business expenses & Section 179 depreciation
Deducting necessary business expenses—such as software subscriptions, marketing costs, and contractor fees—is standard practice. However, larger purchases, often considered asset acquisition, offer a unique planning opportunity through Section 179 depreciation. This tax code allows business owners to write off the full purchase price of qualifying equipment (like computers, vehicles, or machinery) in the current tax year, rather than depreciating it over several years, through Section 179 depreciation.
The Quadratic use case
This creates a classic "Purchase vs. Wait" scenario. A freelancer might be eyeing a new $3,000 laptop. In Quadratic, they can create a scenario where they purchase the laptop in December versus January. The model will show if the immediate reduction in taxable income justifies the cash outlay now, or if it is better to preserve cash flow and delay the tax benefit until next year.
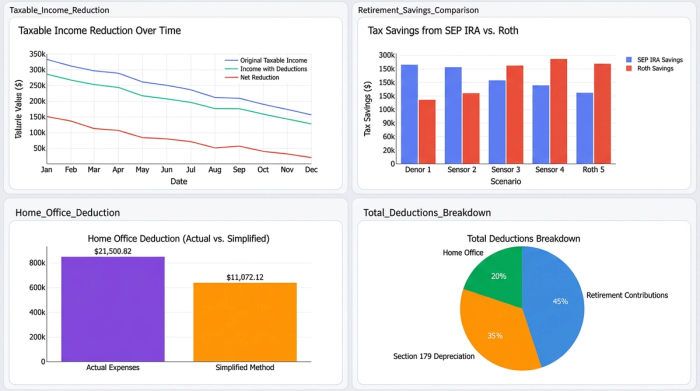
The home office deduction
If you use part of your home exclusively for business, you can write off a portion of your housing expenses. The IRS offers two home office deduction methods: the "Simplified Method" (a standard rate of $5 per square foot up to 300 square feet) and the "Actual Expenses" method (calculating a percentage of mortgage interest, utilities, and insurance).
The Quadratic use case
Calculating "Actual Expenses" is tedious in a standard spreadsheet, but essential if you live in a high-cost area. In Quadratic, a user can build a formula that aggregates their total housing costs and applies the square-footage percentage. They can then create a toggle to switch between "Simplified" and "Actual." The spreadsheet instantly highlights which method yields the higher deduction, ensuring no money is left on the table.
The workflow: modeling scenarios in Quadratic
The difference between a frantic tax season and a calm one is often the tool you use. While standard spreadsheets are great for lists, Quadratic’s infinite canvas and integrated coding features allow for robust FP&A modeling that acts as a decision engine. Here is how a self-employed taxpayer uses Quadratic to navigate tax planning.
Step 1: The data aggregation
The workflow begins by bringing financial data, often facilitated by an expense and income tracker, into Quadratic’s infinite canvas. Because the workspace is unbounded, the user can place their income statements, expense logs, and bank exports side-by-side without navigating multiple tabs. Users can connect to data sources or simply paste in CSVs of their yearly transactions.
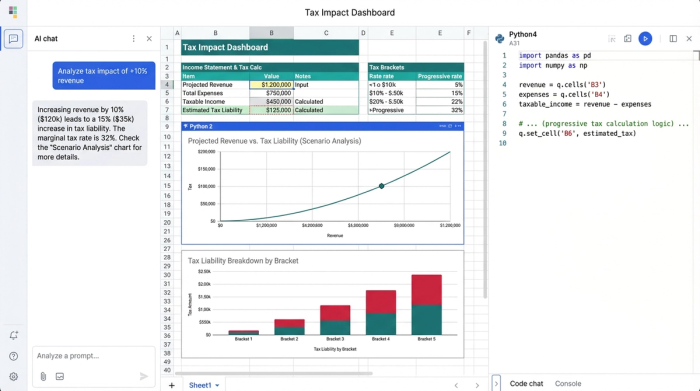
Step 2: The "what-if" analysis
Once the data is present, the user creates a "Tax Impact Dashboard." This is a set of cells defined by formulas that calculate Gross Income, AGI, and Estimated Tax.
This is where the magic happens. The user can adjust variables to test different futures. They might type "Yes" into a cell labeled "Buy New Server" or adjust their "Projected Revenue" for December. Because Quadratic supports Python and complex formulas, the "Estimated Tax Liability" cell updates automatically. This real-time feedback loop transforms tax planning from a guessing game into a precise strategy session.
Step 3: Documentation and compliance
Research shows that many self-employed professionals avoid taking legitimate deductions because they fear an audit. Quadratic helps solve this by allowing users to link specific deductions in their model directly to the source of truth. A cell containing a travel deduction can be linked to the specific log or receipt file. This turns the spreadsheet into an audit-proof checklist, providing the documentation required to substantiate every claim.
How to Reduce Taxable Income for High Earners
As income rises, standard deductions become less impactful, and the complexity of tax planning increases. High earners often hit tax brackets where a small calculation error can cost thousands of dollars.
How to reduce taxable income for high earners typically involves more advanced tax optimization strategies. This includes maximizing Health Savings Accounts (HSAs), which offer triple tax benefits, or strategically timing client invoices. If a high earner has had a particularly lucrative year, they might delay sending December invoices until January 1st, pushing that taxable income into the next year when their tax bracket might be lower.
Modeling these nuances in Quadratic is critical. For high earners, the interplay between the Alternative Minimum Tax (AMT), investment income, and business revenue requires precision that simple calculators cannot provide. Quadratic allows these users to build custom Python scripts within the spreadsheet to handle complex tax logic, ensuring their projections are accurate.
Frequently asked questions
How Do You Reduce Taxable Income if You Take the Standard Deduction?
Even if you take the standard deduction, you can still lower your taxable income through "above-the-line" deductions. These include contributions to traditional IRAs, SEP IRAs, HSAs, and self-employed health insurance premiums. These are subtracted from your gross income to determine your AGI before the standard deduction is applied.
What is the difference between a tax credit and a tax deduction?
A tax deduction lowers your taxable income (the amount you are taxed on), while a tax credit reduces your tax bill dollar-for-dollar. For example, a $1,000 deduction might save you $240 if you are in the 24% tax bracket, but a $1,000 credit saves you the full $1,000.
Conclusion
Reducing taxable income requires more than just collecting receipts; it requires foresight and the ability to predict the future of your finances. By moving away from static lists and embracing dynamic modeling, you can make decisions that align your business goals with tax efficiency.
Don't wait until April to find out what you owe. Use Quadratic to build a proactive tax model, test your scenarios, and ensure every deduction is backed by data. There are many ways to reduce taxable income, but the best way is to see the impact of your decisions before you make them.
Try Quadratic, the AI spreadsheet that does your work for you
Use Quadratic to Reduce Taxable Income
- Model the real-time tax impact of different retirement contributions (e.g., SEP IRA vs. Roth) to optimize your AGI.
- Compare "purchase vs. wait" scenarios for business expenses and Section 179 depreciation to time deductions effectively.
- Calculate and toggle between home office deduction methods (simplified vs. actual expenses) to maximize your write-off.
- Aggregate all financial data—income, expenses, and bank exports—on an infinite canvas for a comprehensive tax overview.
- Perform "what-if" analysis to see how financial decisions instantly affect your estimated tax liability.
- Create an audit-proof record by linking deductions in your model directly to supporting documentation.
- Build custom tax logic with Python for complex scenarios, ensuring accurate projections for high earners.
Ready to take control of your tax planning? Build your proactive tax model and make data-backed decisions. Try Quadratic