Managing heart health, often achieved through a personal patient tracker, is a daily commitment that often relies on a single, crucial habit: consistent monitoring. For millions of individuals managing hypertension or following Self-Measured Blood Pressure (SMBP) protocols, the daily ritual of the cuff and the monitor is familiar. However, the step that follows—recording that data—is often where the process breaks down.
Many patients rely on handwritten notebooks, loose scraps of paper, or static printable files that eventually become a jumble of unorganized numbers, hindering effective data analysis in healthcare. While capturing the data is the first step, the true value of monitoring lies in understanding what those numbers mean over time, enabling effective health data exploration. A list of raw figures does not tell a story, nor does it highlight the subtle trends that a clinician needs to see to adjust medication or lifestyle recommendations effectively.
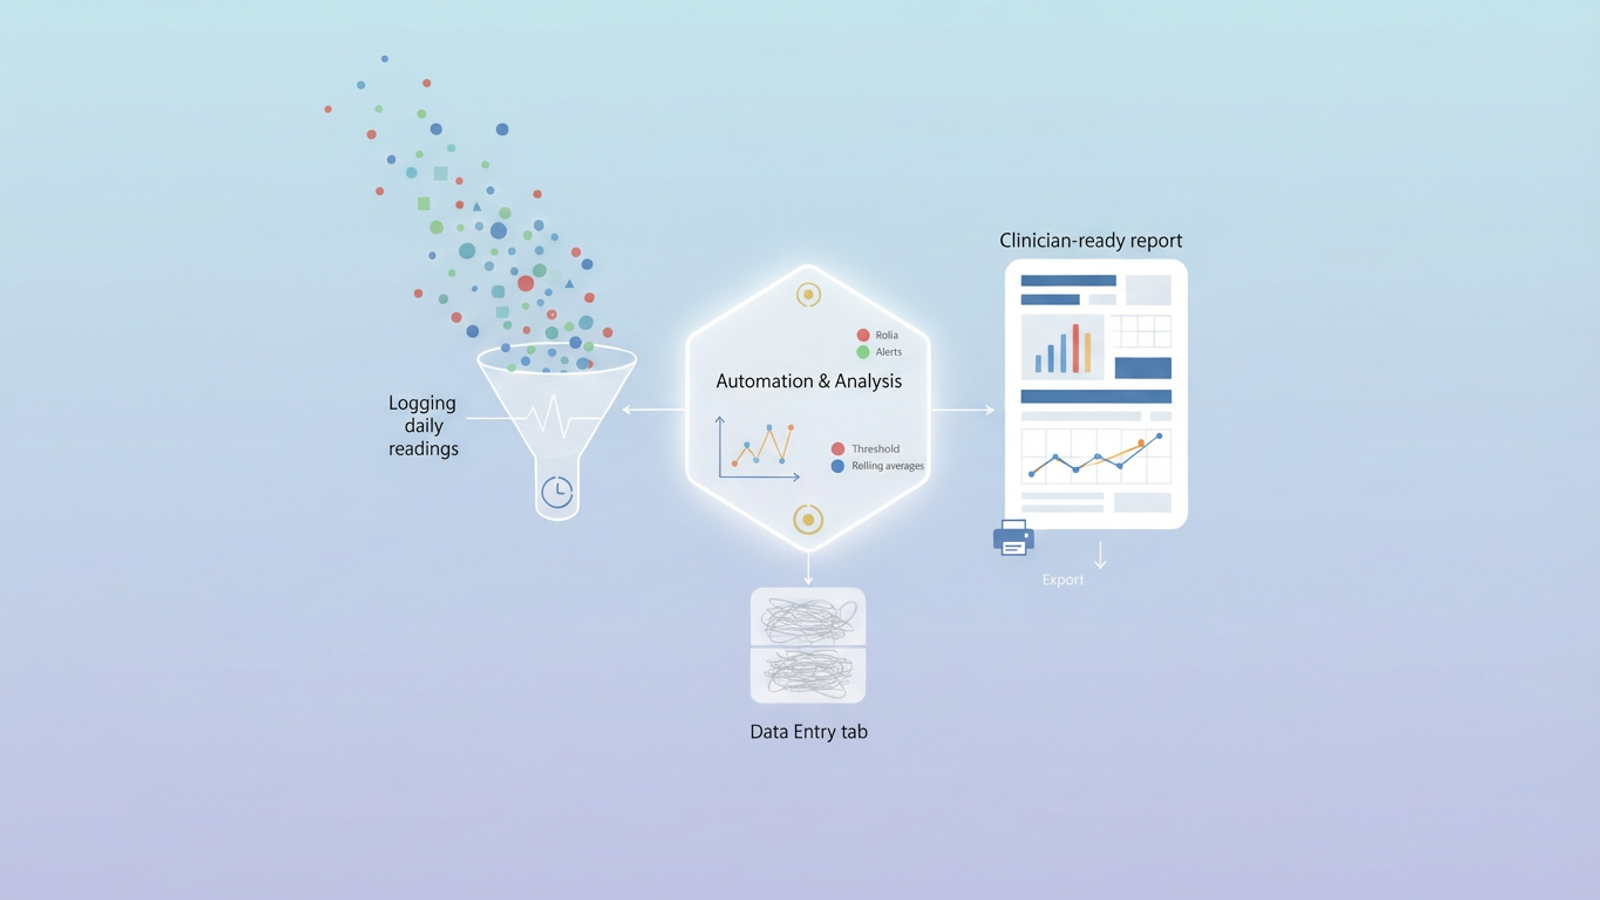
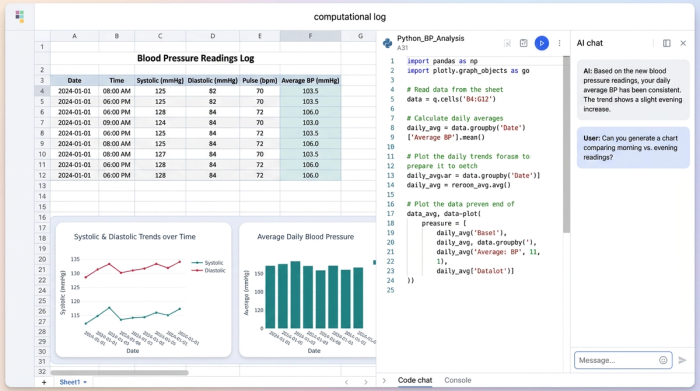
This is where the concept of a "computational" log changes the landscape of personal health management. Instead of treating your blood pressure log as a passive storage bin for numbers, you can treat it as an active analytical tool. By moving from static paper to a dynamic environment like Quadratic, you can separate the messy work of raw data entry from the clean, insightful reporting your doctor actually needs. This approach doesn't just record your systolic and diastolic readings; it calculates averages, identifies trends, and formats the results automatically, turning daily data points into a clear narrative about your health.
Why standard PDF logs fall short
When a doctor recommends tracking your blood pressure at home, they often point patients toward standard resources. The American Heart Association blood pressure log is the gold standard for what to measure, emphasizing the importance of capturing the date, time, pulse, and specific readings accurately. These guidelines are medically essential, ensuring that the data collected is standardized and reliable.
However, the format in which this data is captured often creates a "data display" gap. A typical free blood pressure log sheet pdf is a static grid. You print it out, write your numbers in small boxes, and repeat this process for weeks. When you bring these sheets to a medical appointment, your clinician is presented with rows upon rows of raw handwritten data.
This presents a significant challenge. Effective diagnosis and treatment adjustments rely heavily on context. A single high reading might be an anomaly caused by stress or caffeine, while a consistent creeping rise in morning pressure is a trend that requires attention. Static logs force the doctor to perform mental math on the spot to guess averages or spot patterns amidst the noise. They cannot automatically filter out outliers or visualize the trajectory of your health over the last month. By relying on paper, patients inadvertently hide the most valuable insights their data has to offer.
Building a smarter blood pressure log
To bridge the gap between daily measurement and clinical insight, we need a Python spreadsheet that combines the ease of a spreadsheet with the power of automated analysis. This is the core philosophy behind using a Quadratic template for health tracking. Unlike a traditional spreadsheet that might require complex manual configuration, Quadratic integrates native code and formulas to handle the heavy lifting in the background.
The result is a smart log that updates in real-time. As you enter your daily numbers, the system is already working to clean, average, and visualize that data. You do not need to be a data analyst to use it; you simply need to input your readings, and the template ensures that the output is polished, professional, and ready for your doctor’s review.
1. Logging your daily readings
The foundation of any effective tracking system, like a daily habit tracker, is ease of use. If a log is difficult to update, it will eventually be abandoned. In this workflow, the user experience is centered on a dedicated "Data Entry" tab designed for speed and simplicity.
Here, you track the essential metrics aligned with the AHA blood pressure log standards. You enter the date and time, your systolic (top number) and diastolic (bottom number) readings, and your pulse. Including a blood pressure and pulse log in one place provides a more comprehensive view of cardiovascular health.
Crucially, this smart log also includes a field for context notes. This allows you to tag readings with relevant lifestyle information, such as "missed morning medication," "high sodium dinner," or "post-exercise." In a standard spreadsheet or paper log, these notes often clutter the view. In Quadratic, they are stored alongside the data but kept separate from the visual reports, ensuring that the context is available when needed without making the summary look messy.
2. Automating analysis and alerts
Once the data is entered, the "smart" layer of the log takes over, leveraging principles often seen in AI in clinical data management. Using Python and advanced formulas, the template instantly processes the raw numbers to provide immediate feedback.
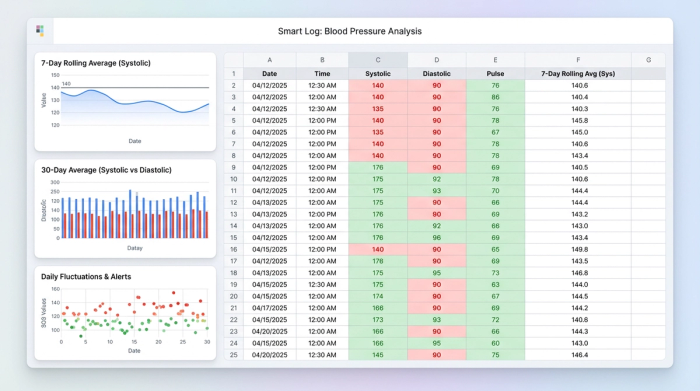
One of the most clinically significant features is the calculation of rolling averages. Doctors rarely make decisions based on a single reading because blood pressure fluctuates constantly throughout the day. A 7-day or 30-day rolling average provides a much more accurate picture of your baseline health. The log calculates these averages automatically, smoothing out the daily spikes and dips to reveal the true direction of your blood pressure control.
Furthermore, the log utilizes threshold alerts. You can set specific parameters based on your target range—for example, flagging any systolic reading over 140 or diastolic over 90. The system automatically color-codes these entries, perhaps turning a cell red or bolding the text. This acts as an immediate feedback loop. You don't have to wait for your next doctor's appointment to know if your numbers are slipping out of range; the log tells you instantly, prompting you to double-check your reading or consider recent lifestyle factors.
3. Visualizing your health trends
Human beings are visual creatures, and this applies to clinicians as well. A grid of numbers is abstract, but a line graph showing a downward trend in blood pressure over three months is undeniable proof of progress.
Moving beyond the grid, the template generates charts that visualize your health journey. These visuals help communicate the story of your health instantly, much like an executive dashboard provides quick insights for decision-makers. If you started a new medication two months ago, the chart will clearly show the correlation between that date and the subsequent change in your readings. This solves the "optimizing display" problem that plagues static PDFs. Instead of asking your doctor to hunt for patterns, you present them with a clear visual argument. This not only saves time during short appointments but also empowers you to advocate for your own health with data-backed confidence.
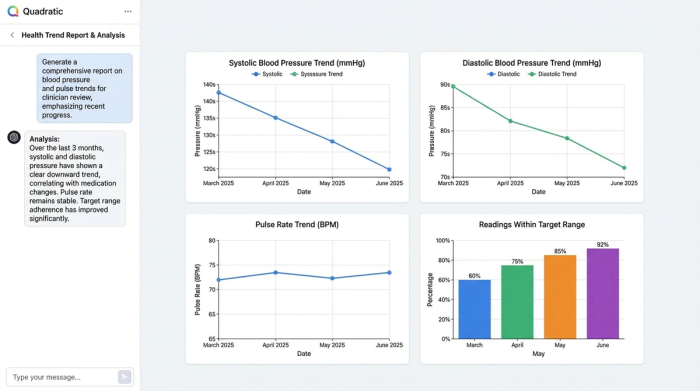
4. Generating a clinician-ready report
Despite the advantages of digital tools, the medical world still relies heavily on documents. There is a high search volume for blood pressure log PDF because patients need something tangible to hand to their doctor or attach to a patient portal message.
Quadratic satisfies this need without sacrificing the benefits of digital analysis. The template separates the "messy" raw data entry from a clean "Summary View." This summary view is designed specifically for export. It creates a polished, professional document that highlights your averages, displays your trend charts, and lists any flagged readings with their associated notes.
You can export this specific view as a printable blood pressure log or a PDF file. The difference is that this is a PDF generated from your data, not a blank form you have to fill out by hand. It offers the best of both worlds: the analytical power of a digital tool and the compatibility of a standard medical document. You walk into your appointment with a report that looks professional and provides high-value insights immediately.
Conclusion: Better data, better health
The shift from a manual blood pressure log to an automated, analytical wellness tracker is more than just a technological upgrade; it is a step toward proactive health management. By moving away from static paper sheets and messy notebooks, you remove the friction of data entry and gain the power of immediate insight.
Your health data tells a story, but only if you have the right tools to listen. Instead of relying on a free printable blood pressure and pulse log PDF that offers no feedback, choose a method that helps you understand your body's trends and communicate them clearly to your care team. When you present your doctor with clean, analyzed data rather than raw numbers, you enable them to make better decisions for your long-term health.
Try Quadratic, the AI spreadsheet that does your work for you
Use Quadratic to track and analyze your blood pressure log
- Automatically calculate daily, 7-day, and 30-day rolling averages of your systolic and diastolic readings, eliminating manual computations.
- Visualize health trends instantly with clear charts and graphs, making patterns and progress easy to understand.
- Get real-time alerts for out-of-range readings by setting custom thresholds that automatically flag and color-code entries.
- Organize contextual notes about medication, diet, or activity alongside your readings without cluttering analytical reports.
- Produce clinician-ready reports by exporting polished summaries with analyzed averages, trend charts, and flagged readings, perfect for doctor's appointments.
Start managing your health data more effectively today. Try Quadratic.