
Table of contents
- The challenge of fragmented Cost Estimation Analysis
- Step 1: Consolidating your Welding Estimates into a master workbook
- Step 2: Fixing formula errors and ensuring data integrity
- Step 3: Structuring your Cost Analysis and Estimation data
- Step 4: Building a CEO-ready executive sales dashboard
- Step 5: Automating the weekly pipeline update
- Conclusion: Unify your Cost Estimate Analysis in Quadratic
Managing complex quotes and forecasts across multiple spreadsheets is a massive pain point for sales leaders in fabrication and heavy industries. When your team is dealing with intricate welding estimates and multi-layered project bids, disconnected data inevitably leads to formula errors, hours of manual weekly updates, and a frustrating lack of real-time visibility for the executive team, with some studies highlighting the significant annual cost of manual reporting errors.
For many sales directors, the weekly reporting routine involves pulling data from half a dozen different files, fixing broken cells, and trying to format a coherent summary before a leadership meeting. This fragmented approach to cost estimate analysis drains valuable time that could be spent coaching estimators or closing deals.
This article walks through the real workflow of a Director of Sales in the fabrication industry who used Quadratic to unify their disparate data. By transitioning to a modern AI spreadsheet, they were able to fix broken formulas permanently, consolidate their pipeline, and build an automated, CEO-ready executive dashboard.
The challenge of fragmented Cost Estimation Analysis
Before moving to a unified workspace, our Director of Sales was managing detailed quote logs, estimator performance tracking, and sales funnels across dozens of isolated spreadsheets. Each estimator had their own tracking method, and market capacity information lived in yet another siloed document.
The friction peaked every week during the pipeline update. Preparing for the weekly CEO meeting meant manually copying and pasting new estimate data from individual rep files into a master tracker. This manual cost estimation analysis was incredibly prone to human error. A single misplaced decimal or overwritten cell could throw off the entire quarterly forecast. Instead of analyzing the data to make strategic decisions, the sales leader was stuck playing the role of a spreadsheet troubleshooter, wasting hours just to get the numbers to line up.
Step 1: Consolidating your Welding Estimates into a master workbook
The first step to escaping the cycle of manual updates is transitioning from isolated, static spreadsheets to a dynamic master workbook in Quadratic. Because Quadratic combines the familiarity of a traditional spreadsheet with powerful data integration, it serves as a true single source of truth.
In this use case, the sales director began by ingesting all their raw data into one workspace. They imported the detailed quote logs, market capacity information, and individual estimator performance metrics. By bringing these welding estimates into a single environment, they eliminated the need to constantly jump between different files. Everything required for a comprehensive estimated cost analysis now lived in one collaborative, browser-based grid, setting the foundation for accurate forecasting.
Step 2: Fixing formula errors and ensuring data integrity
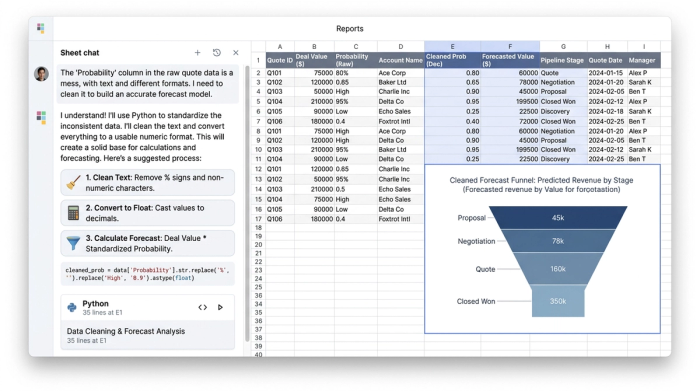
When you import raw quote data from different estimators, you almost always run into common data integrity issues. One of the most common and frustrating roadblocks in spreadsheet reporting is the dreaded #VALUE! error.
In estimating workflows, this usually happens because of text and number mismatches. For example, an estimator might accidentally type a space after a number in a probability column, or a CRM export might format currency as plain text. When your high-level pipeline formulas try to multiply a proposed project value by a corrupted probability percentage, the calculation breaks.
Using Quadratic, the sales director was able to quickly identify and clean these inconsistencies. Whether using built-in AI flows to instantly reformat columns or applying simple data-cleaning formulas, they standardized the probability and forecast fields. This ensured that every calculation was perfectly accurate before the data ever reached the executive level.
Step 3: Structuring your Cost Analysis and Estimation data
With clean data in place, the next step is structuring it for high-level analysis. Accurate cost analysis and estimation require strict data categorization. To generate reliable forecasts, the sales director set up weighted projections by quarter and year based on the newly cleaned probability metrics.
This level of structured categorization is critical in heavy industries. Methodologies like the account analysis method of cost estimation rely on separating costs behaviorally, such as splitting fixed and variable expenses or isolating labor from materials. Similarly, standards in construction cost analysis and estimating require exact categorization to ensure margins remain profitable as project scopes change. By structuring the data logically within Quadratic, the director created a reliable framework where every quote was properly categorized by project status, region, and equipment type.
Step 4: Building a CEO-ready executive sales dashboard
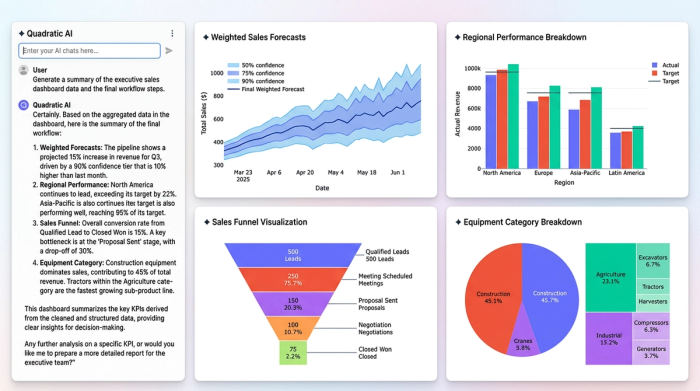
Executives do not want to scroll through thousands of rows of raw quote logs. They need a clean, top-level summary that drives immediate strategic decision making. With the underlying data cleaned and structured, the sales director built a polished dashboard layer directly within the same Quadratic workbook.
This executive sales dashboard aggregated the most critical key performance indicators. It featured weighted forecasts sliced by equipment category, regional performance breakdowns, and clear visualizations of the overall sales funnel. Because Quadratic allows teams to keep their logic, context, and outputs in one place, the dashboard visually summarized the pipeline while remaining seamlessly connected to the granular estimate data beneath it.
Step 5: Automating the weekly pipeline update
A dashboard is only useful if it stays current. Instead of rebuilding the report from scratch every week, the sales director used Quadratic to automate the workflow.
New estimating spreadsheets and updated quote logs can be easily fed into the Quadratic master workbook. Because the data cleaning rules and dashboard visualizations are already established, the new data simply flows through the system. The complex cost estimation and analysis that used to take hours of manual data entry and error checking now takes minutes. This automation sustains the dashboard effortlessly, freeing up the sales director to focus on strategy, team coaching, and revenue growth.
Conclusion: Unify your Cost Estimate Analysis in Quadratic
The journey from messy, error-prone spreadsheets to a unified, automated executive dashboard does not require a complex tech stack. By bringing their data into Quadratic, this Director of Sales solved the root causes of their reporting headaches. They eliminated manual copy-pasting, resolved persistent formula errors, and created a reliable cost analysis and estimation workflow that updates in minutes instead of hours.
You do not need separate tools or dedicated analysts for data cleaning, forecasting, and dashboarding. Quadratic handles the end-to-end workflow in a single, intuitive workspace. If you are ready to streamline your sales reporting and transform your cost estimate analysis, bring your data into Quadratic and build a dashboard your executive team can trust.
Use Quadratic to streamline cost estimate analysis
- Unify scattered data: Consolidate detailed quote logs, estimator performance, and market capacity into a single, dynamic master workbook, eliminating fragmented spreadsheets.
- Eliminate formula errors: Quickly identify and correct data inconsistencies, such as text/number mismatches, ensuring precise calculations for all welding estimates and forecasts.
- Structure data for strategic insights: Categorize and organize complex cost data by project status, region, and equipment type to enable accurate weighted projections and reliable analysis.
- Build automated executive dashboards: Create CEO-ready dashboards that provide real-time, high-level summaries of your pipeline and weighted forecasts, directly linked to granular estimate data.
- Automate weekly reporting: Streamline pipeline updates by easily feeding new estimate data into your system, allowing dashboards to refresh in minutes, not hours.
Ready to transform your cost estimate analysis? Try Quadratic.