Table of contents
For modern logistics teams, the core challenge of pricing is a delicate balancing act. You need to maintain competitive win rates while strictly protecting profitability. Mastering this balance requires rigorous freight spend analysis, which is the key to unlocking revenue share and clearly demonstrating customer savings.
However, many pricing analysts fall into a familiar trap. They either try to manage thousands of shipments in fragile Excel files that crash under the weight of the data, or they are forced into expensive, black-box enterprise pricing engines that offer zero flexibility.
There is a better way to operate. This article explores a real-world walkthrough of how a pricing analyst built a dynamic pricing model for 2,455 shipments using Quadratic. By bridging the gap between spreadsheet flexibility and enterprise-grade data handling, this analyst created a system that wins freight without sacrificing margin.
The strategic shift: From static pricing to dynamic freight spend analysis
Relying on a static, one-size-fits-all markup strategy is a guaranteed way to lose money in volatile freight markets. When costs fluctuate, applying a flat percentage across the board leads directly to margin leakage. To prevent this, logistics professionals must transition to lane-level profitability analysis, evaluating the unique cost and competition variables of every single route.
This transition brings up the classic spreadsheet versus software dilemma. Traditional spreadsheets simply break down under the weight of multi-variable freight data. Analysts constantly battle spill errors, broken calculation pipelines, and frozen screens. On the other end of the spectrum, enterprise transportation management systems and AI pricing tools are often too rigid and prohibitively expensive for custom workflows.
Quadratic serves as the missing middle ground. It is the modern evolution of the logistics spreadsheet, offering a tool that handles complex calculations and massive datasets without losing the familiar grid interface that analysts prefer.
Real-world workflow: Optimizing lane-by-lane margins in Quadratic
Understanding the difference between margin vs. markup is just the beginning. The real challenge is executing that logic across thousands of rows of live data. Here is exactly how one logistics analyst used Quadratic to execute a highly targeted freight spend analysis and optimize lane-level profitability.
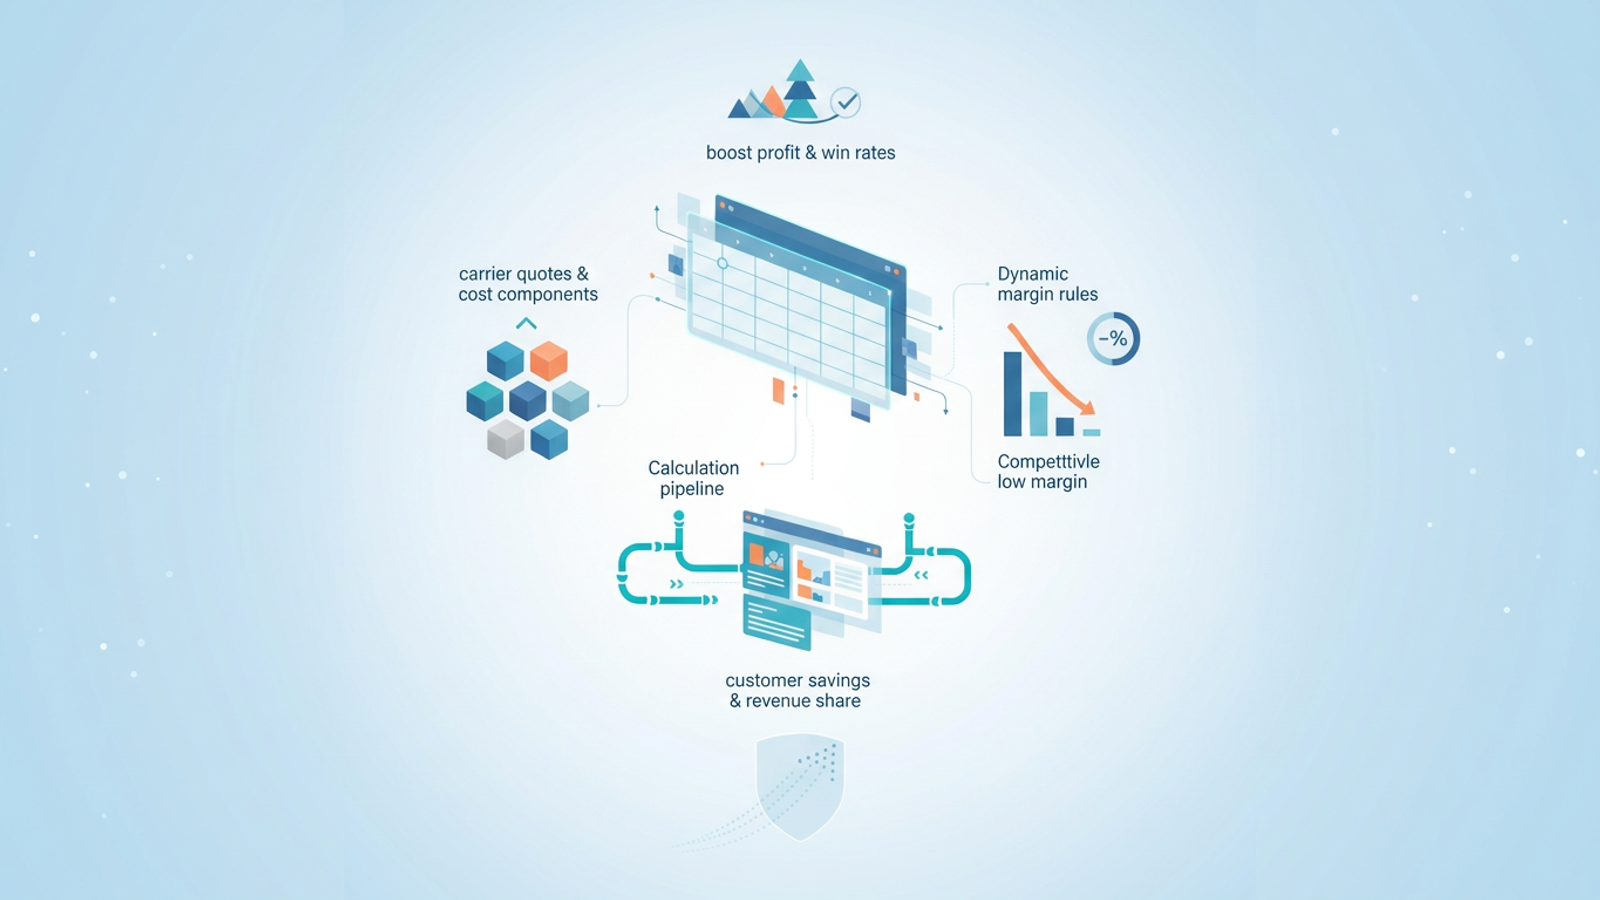
Step 1: Ingesting complex carrier quotes & cost components
The analyst started with a massive dataset requiring immediate organization, highlighting the challenges of managing complex logistics data. They needed to process 2,455 shipments featuring multiple carrier quotes, fuel margins, and base cost components. In a legacy spreadsheet, pasting this much raw data from a transportation management system often causes immediate formatting errors.
Quadratic easily handles interdependent tables and sheets. The analyst connected their raw data sources directly into the grid, maintaining absolute data integrity right from the ingestion phase. Every cost component was neatly organized, giving the analyst a clean foundation for the complex math ahead.
Step 2: Applying dynamic 10% to 15% margin rules
With the data ingested, the analyst needed to apply specific pricing logic. The goal was to set a baseline 15% margin on buys and fuel. However, they also needed dynamic freight pricing capabilities to adjust these numbers based on market conditions.
The analyst built logic to lower margins to 10% on highly competitive lanes to win volume, while simultaneously increasing margins on lanes where there was headroom to maximize revenue share. Because Quadratic allows users to write robust formulas, SQL, and Python directly in the grid, the analyst was able to automate these margin controls seamlessly across all 2,455 rows.
Step 3: Eliminating spill issues and fixing the calculation pipeline
Manual analysis is heavily constrained by technical limitations. Previously, the analyst struggled with Excel spill issues, complex pipeline updates, and persistent currency and percentage formatting errors. These roadblocks turned routine pricing updates into hours of troubleshooting.
Quadratic provided immediate technical superiority. The user resolved their previous code errors and utilized Quadratic's robust architecture to maintain a smooth, automated recalculation process. Even as new carrier data is added to the 2,455 shipments, the pipeline never breaks. The formatting remains locked in, and the logic executes flawlessly.
Turning data into decisions: Feeding the executive dashboard
A successful freight spend analysis does not end in the spreadsheet. To truly impact the business, those numbers must translate into actionable business intelligence for leadership.
The clean, automated data pipeline built in Quadratic calculates expected capture rates and projected profits in real time. This structured output then seamlessly feeds into executive dashboards and sales presentations. Instead of waiting days for a static report, leadership can look at the live data and make fast, data-backed decisions on pricing strategies.
Why Quadratic is the modern logistics spreadsheet
By moving their workflow to Quadratic, the pricing analyst achieved their ultimate goal. They successfully balanced competitive pricing, increased their company's revenue share, and clearly demonstrated customer savings across the board.
Quadratic offers the perfect middle ground for logistics professionals. It provides the limitless customization of a traditional grid combined with the data integrity and processing power of a modern data science tool.
Ready to upgrade your freight pricing strategy?
Logistics data professionals no longer need to fight with broken Excel pipelines or conform to rigid SaaS platforms. You can take control of your data and build workflows that actually scale with your business.
Try Quadratic today to build your own dynamic pricing models, automate your freight spend analysis workflows, and turn your complex logistics data into your greatest competitive advantage.
Use Quadratic to Optimize Freight Spend Analysis
- Seamlessly ingest and organize thousands of shipments: Connect complex carrier quotes and cost components without spreadsheet crashes or formatting errors, even with massive datasets.
- Automate dynamic lane-level pricing: Apply sophisticated margin rules (e.g., 10-15%) using Python, SQL, or formulas directly in the grid to adapt to market conditions and win rates.
- Eliminate calculation errors and broken pipelines: Ensure flawless, automated recalculations across all your freight data, preventing spill issues and maintaining data integrity.
- Power real-time executive dashboards: Automatically feed projected profits and capture rates into live reports, enabling faster, data-backed strategic pricing decisions.
- Balance competitive pricing with profitability: Gain the flexibility of a custom spreadsheet combined with enterprise-grade data handling to secure more freight without sacrificing margin.
Ready to take control of your freight pricing? Try Quadratic to build dynamic models and automate your analysis.