
In the current economic landscape, volatility is the only constant. For CFOs and FP&A professionals, robust FP&A modeling is essential, as a static financial plan is often obsolete the moment it is finalized. Market conditions shift, supply chains disrupt, and capital costs fluctuate, rendering a single-view budget dangerous. Modern finance leaders need models that adapt to these changes in real-time, allowing them to navigate uncertainty with confidence.
At its core, what is scenario analysis? It is a method used in financial modeling to predict future values by changing input variables based on different potential realities. Rather than relying on a single "hoped-for" outcome, it allows businesses to stress-test their assumptions against various strategic situations.
However, the practical application of this concept often leads to "version control hell." Finance teams frequently find themselves managing five different Excel files—labeled "v1_Final," "v2_Upside," and "v3_WorstCase"—struggling to keep logic consistent across them all. The solution lies in moving away from static files toward dynamic modeling. By using a platform like Quadratic, you can build models where drivers are linked and scenarios are switched via simple toggles, allowing you to view different financial futures without ever clicking "Save As."
What is scenario analysis in financial modeling?
Scenario analysis is the standard "triptych" approach to risk assessment used by strategic finance teams. It moves beyond simple budgeting—even that produced by an AI budget generator—by acknowledging that the future is a range of possibilities, not a single point. By constructing distinct worlds—usually a Base, Upside, and Downside case—a company can determine its capital requirements and operational pivot points before a crisis hits.
Typically, these scenarios break down as follows:
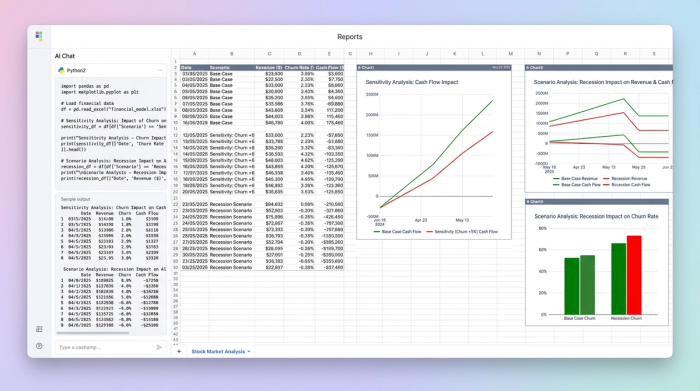
- Base Case: The most likely outcome based on current trends, historical performance, and reasonable market assumptions. This is the operating plan the company executes against.
- Upside Case: A world where everything goes right. High growth, low churn, and efficient customer acquisition. This scenario helps plan for resource constraints if demand outstrips capacity.
- Downside Case: The recession or operational failure scenario. This models low growth, high churn, or supply chain shocks. The goal here is to understand the company's survival baseline.
Sensitivity analysis vs. scenario analysis
A common point of confusion in financial modeling is the difference between sensitivity analysis vs scenario analysis. While they are related, they serve different purposes in risk assessment.
Sensitivity analysis is often referred to as a "what-if" analysis for a single variable. It asks, "What happens to our net income if the price drops by 10%?" while holding all other variables constant. It isolates the impact of one specific driver.
In contrast, scenario analysis changes multiple variables simultaneously to tell a cohesive story. For example, asking "What happens in a recession?" implies that price might drop, churn will rise, and hiring will freeze all at the same time. When comparing scenario vs sensitivity analysis, remember that sensitivity tests the mechanics of a specific lever, while scenario analysis tests the resilience of the entire business strategy against a complex event.
The prerequisites: structuring a driver-based model
Before you can run effective scenarios, the underlying financial model, such as a startup financial model, must be built correctly. A rigid model with hard-coded numbers in the cells cannot flex. To perform true analysis, you need a dynamic, driver-based 3-Statement Model where the Income Statement, Balance Sheet, and Cash Flow are mathematically linked.
The key is to avoid hard-coding values directly into the financial statements. Instead, you must identify the key drivers—the 20% of variables that determine 80% of the variance in your business.
In a Quadratic workflow, a CFO isolates these specific drivers into a dedicated assumptions area. Common drivers include Pricing, Churn, Headcount, Customer Acquisition Cost (CAC), Cost of Goods Sold (COGS), and Payment Terms.
When performing scenario analysis excel workflows often become fragile here. To link these drivers in traditional spreadsheets, analysts frequently build complex "index-match" or nested "if" statements that break easily when rows are added. In Quadratic, data flows can be structured more logically, ensuring that when a driver changes, the downstream impact on cash flow is calculated instantly and accurately without fear of reference errors.
Step-by-step: building a dynamic scenario workflow
The power of using a modern tool like Quadratic lies in the ability to centralize logic. Instead of building three separate models, you build one model that can behave in three different ways. Here is how a CFO can set up a dynamic operating model.
Step 1: Link drivers to financial statements
The first step is to ensure that every line item in your P&L, crucial for effective P&L analysis, and Balance Sheet is a formula derived from your driver inputs. For instance, your Revenue line should not be a static number; it should be a calculation of (Current Customers - Churn + New Customers) * Price. Your Operating Expenses should be directly linked to your Headcount driver. By establishing these relationships, you create a hydraulic system where pressure applied to one driver moves the entire model.
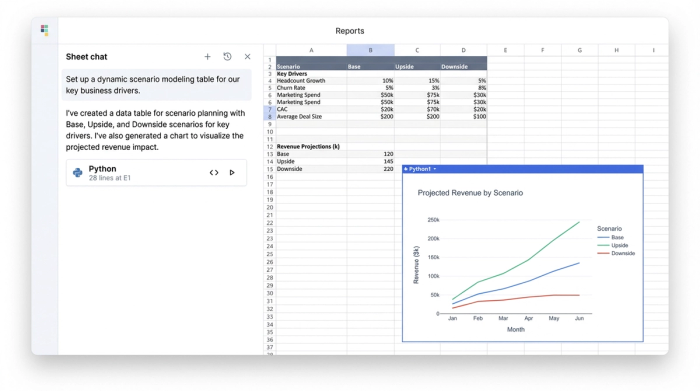
Step 2: Define the scenarios
Instead of creating new tabs for Base, Upside, and Downside, you define the logic for these worlds in a data table. You might set up a "Headcount Growth" driver that is 10% in the Base case, 20% in the Upside case, and 0% in the Downside case. You repeat this for all key variables, creating a matrix of assumptions that defines each scenario.
Step 3: Implement toggles for instant switching
This is where the workflow differentiates itself. In Quadratic, you can create a native toggle or a dropdown selector that acts as the master switch for the model. The CFO sets up a logical flow where the model looks at the toggle state (e.g., "Downside") and pulls the corresponding assumptions into the calculations.
This replaces the pain point of formatting sheets for quick adjustments. Rather than manually typing over assumption cells during a meeting, you simply flip the switch. The changes propagate instantly across the Income Statement and Balance Sheet, recalculating net income and cash balances in real-time.
Step-4: Visualize the outcomes
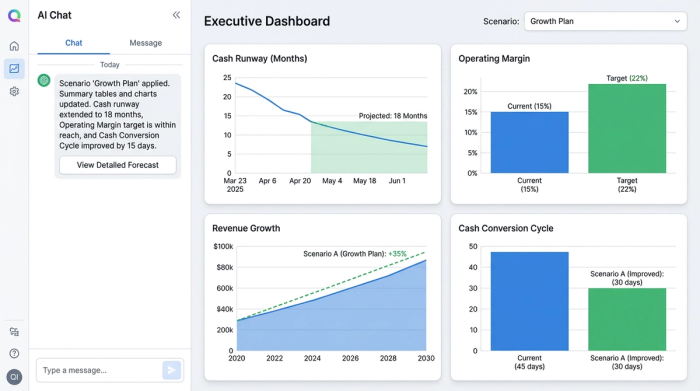
The final step is translating these calculations into decision-grade insights. You can create summary tables specifically designed to track vital metrics like Runway, Margin, and Cash Conversion Cycle.
Because the model is dynamic, changing the scenario toggle instantly updates these summary tables. You can immediately see the impact: switching to the "Downside" case might show the runway dropping from 18 months to 9 months. This real-time feedback loop allows the finance team to highlight sensitivities and discuss mitigation strategies—such as cutting burn or extending payment terms—while the data is fresh on the screen.
Best practices for effective scenario modeling
To get the most out of your analysis, it is important to follow a few strategic best practices. First, avoid "over-modeling." It is tempting to create scenarios for every minor variable, but this leads to analysis paralysis. Stick to the drivers that actually move the needle for your specific business model, such as those found in a SaaS financial model template.
Second, use visual sensitivity to make risks obvious. Don't bury the critical numbers in rows of black text. Use conditional formatting or highlights to alert stakeholders when a scenario causes cash to dip below a safety threshold or when margins compress dangerously.
Finally, consider the tools you are using. When searching for the best software for scenario analysis, many professionals default to what they know. Traditional spreadsheets are excellent for calculation but often struggle with presentation and rapid scenario switching. Dedicated FP&A software can be too rigid and expensive to implement for agile teams.
Quadratic bridges this gap. It offers the flexibility of a spreadsheet combined with the structural integrity required for complex modeling. By allowing users to mix formulas, Python, and SQL, it enables finance leaders to build robust, toggle-based models that act like applications, providing a clear view of the future without the fragility of legacy spreadsheets.
Conclusion
Scenario analysis is not just about predicting the future; it is about preparing for it. The goal is not to guess the exact revenue number for next year but to understand the boundaries of your business model and how it behaves under stress, a process often aided by a robust financial forecast template.
By moving from static, disconnected files to dynamic, toggle-based models, CFOs can transform their role in strategic meetings. Instead of saying, "I'll run the numbers and get back to you next week," they can answer "What if?" questions instantly. Modeling your first Base, Upside, and Downside workflow in Quadratic empowers you to navigate uncertainty with speed and precision, turning financial data into a competitive advantage.
Use Quadratic to do scenario analysis
- Eliminate "version control hell" by building one dynamic model with toggle-based scenarios, not multiple files.
- Instantly switch between base, upside, and downside cases, updating your P&L, Balance Sheet, and Cash Flow in real time.
- Link drivers directly to financial statements for accurate, instant recalculations without fragile "if" statements or reference errors.
- Visualize the immediate impact of each scenario on critical metrics like runway and margins to inform quick strategic decisions.
- Combine spreadsheet flexibility with code-based power (Python, SQL) to build robust, application-like financial models.
Start building dynamic financial scenarios today. Try Quadratic.