
Managing physical inventory across multiple storage locations is a complex challenge, requiring effective inventory management techniques. Most generic spreadsheets quickly become messy, fragile, and hard to navigate as your operations scale. You might have seen expensive software companies claiming that spreadsheets simply cannot handle inventory. But with the right setup, you can build a highly capable, app-like system that rivals specialized software without the hefty price tag.
We are going to walk through how to build a simple stock control spreadsheet in Quadratic. This system will focus purely on physical logistics, stripping away the financial clutter to give you a clean, functional workspace complete with visual dashboards and user-friendly input forms.
Why traditional templates fail (and how Quadratic is different)
If you have ever downloaded a generic inventory stock control spreadsheet template, you likely ran into a few immediate roadblocks. First is the clutter problem. Most templates force you to track purchase prices, sale prices, and profit margins. For warehouse and logistics teams, this is unnecessary bloat. Our system intentionally strips out financial data so you can focus strictly on stock movements and storage locations.
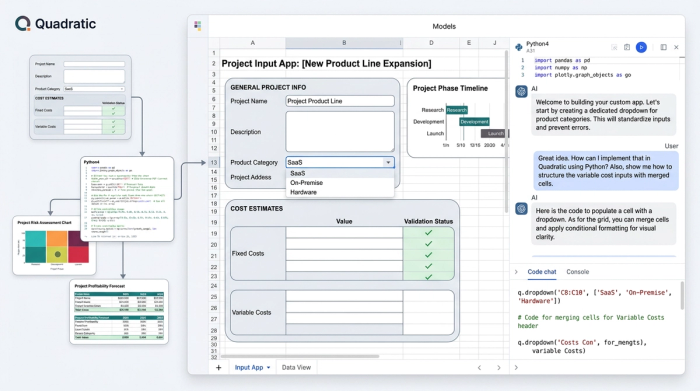
Second is the user experience problem. Standard spreadsheets are often just endless, intimidating grids of raw data. We will use Quadratic to build a clean user interface featuring formatted input areas, merged cells, and helpful dropdowns, adhering to user-friendly design principles.
Finally, there is the visibility problem. Raw data alone does not tell a story. We will solve this by building a dynamic visual dashboard that gives you instant insights into your operations.
Core components of a basic stock control spreadsheet
Before diving into the build, it helps to understand the data architecture of a basic stock control spreadsheet. A robust system relies on four foundational pillars working together.
First is the products table, which serves as your master list of items and includes attributes like product ID, name, category, unit of measure, minimum stock threshold, expiry date, and status. Second is the storage facilities list, detailing exactly where items are kept. Third is the inventory quantities table, which tracks the current stock levels of each product per specific storage location. Fourth is the transaction logs, a historical record of all stock movements going in, out, or between facilities. Structuring your data this way ensures your system remains organized and scalable.
Step-by-step guide: building your stock control spreadsheet example
Let us put these concepts into practice. The following steps will show you how to construct a powerful stock control spreadsheet example inside Quadratic, moving from raw data to a fully functional application interface.
Step 1: Setting up the database (products & locations)
Start by creating the foundational tabular data for your system. Set up dedicated sheets or tables for your products and storage locations. For the products table, create columns for the product ID, name, category, minimum stock level, and expiry date. Notice that we are explicitly leaving out pricing and cost data. By removing purchase and sale price fields, we keep the focus entirely on physical stock control and logistics, preventing the spreadsheet from becoming bogged down with accounting metrics.
Step 2: Designing an app-like user interface
This is where your system transforms from a basic grid into a professional tool. Instead of forcing your team to scroll through hundreds of rows to enter new data, you can design dedicated input forms for adding or removing products and storage locations. Utilize merged cells to create clean, readable form layouts. Apply data validation rules to create dropdown menus for categories and item statuses. By using formatted input areas, you guide users exactly where they need to click and type, drastically reducing the chance of data entry errors.
Step 3: Generating barcodes and QR codes
Modern inventory management relies heavily on scannable labels. You can generate barcodes and QR codes directly within Quadratic for quick product identification. While real-time mobile scanning integration is not natively supported within this browser-based spreadsheet environment, generating these codes is still vital for modern inventory management. You can easily print these labels for physical organization on warehouse shelves and use them to cross-reference items quickly during manual stock counts or audits.
Step 4: Tracking movements and transaction logs
A static inventory count is only helpful until your first shipment arrives. To maintain accurate records, set up a transaction log to track stock as it moves in, moves out, or transfers between different storage facilities. Every time a movement occurs, the user logs the transaction details, including the date, product ID, origin, destination, and quantity. Using formulas, you can link this log directly to your inventory quantities table so that your current stock levels update automatically based on these historical movements.
Step 5: Automating alerts with conditional formatting
Keeping track of dwindling supplies and expiring goods manually is a recipe for stockouts and waste. You can automate these alerts by applying conditional formatting rules to your inventory tables. Set up the logic to automatically highlight rows in red or yellow when a product's current stock falls below its designated minimum stock threshold. You can apply similar rules to flag items when an expiry date is fast approaching, ensuring your team can take proactive measures.
Building a visual inventory dashboard
A great example of stock control spreadsheet functionality is a dynamic dashboard that summarizes your raw data into a high-level view for management, focusing on critical warehouse KPIs.
Include metrics like total products, total storage locations, active low stock alerts, and expiring products. Quadratic allows you to easily create visual charts to track the most used products, analyze inventory distribution across different facilities, monitor expiry trends over time, and visualize historical stock movements. This turns a simple tracking sheet into a powerful reporting tool.
Get started with our free stock control spreadsheet template
You do not have to build this entire system from scratch. You can get a head start by accessing a free stock control spreadsheet template built directly in Quadratic. By using a pre-configured stock control spreadsheet template, you can bypass the initial setup phase and immediately start customizing the interface to match your specific warehouse operations. Enjoy the benefits of an app-like inventory management system without the expensive software-as-a-service fees, financial data clutter, or typical spreadsheet limitations.
Conclusion
Managing physical logistics requires precision and visibility. A stock control spreadsheet does not have to be a fragile, confusing grid that slows your team down. By leveraging Quadratic's advanced user interface capabilities, conditional formatting, and visual dashboards, you can build a professional-grade inventory system tailored exactly to your workflow. Whether you are tracking a few dozen items or managing complex movements across multiple facilities, you have the tools to turn your raw data into a clear, actionable logistics hub.
Use Quadratic to build a stock control spreadsheet
- Design an intuitive, app-like interface for your logistics team, free from unnecessary financial data.
- Streamline data entry with formatted input areas, dropdown menus, and merged cells to reduce errors.
- Automate alerts for low stock levels and expiring products using conditional formatting.
- Generate scannable barcodes and QR codes directly within your sheet for efficient physical tracking.
- Track all stock movements—in, out, and transfers—with automatically updating inventory levels.
- Build dynamic visual dashboards for instant, high-level insights into your entire inventory operation.
Ready to manage your inventory with clarity and precision? Try Quadratic.