
James Amoo, Community Partner
Feb 4, 2026

Excel has long been the default starting point for analytics, largely because of its familiar and flexible spreadsheet interface. For most data teams, it is where analysis begins and, often, where it ends. However, as organizations generate larger volumes of data from multiple data sources, the limitations of traditional spreadsheets become clear.
This is where business intelligence tools such as Power BI come into play. They address many of Excel’s shortcomings by enabling direct connections to live data sources, automated refreshes, advanced visualizations, and centralized dashboards that can be shared across teams. In theory, they represent the natural next step for analysts who have outgrown spreadsheets. In practice, however, adoption is rarely straightforward. BI tools come with challenges like complex setup processes, steep learning curves, and technical skill requirements.
As a result, many teams find themselves in a frustrating middle ground. Excel no longer meets their needs, but traditional BI tools feel too complex, too rigid, or too costly to adopt effectively. The promise of better analytics exists, but the path to getting to the future of data analytics is blocked.
AI-powered spreadsheet tools are emerging to close this gap. They combine the familiarity of spreadsheets with the scale, automation, and visualization capabilities of BI platforms. Users work in a familiar, spreadsheet-like environment while accessing live data, generating charts and dashboards, and iterating on insights at speed.
Instead of configuring models or writing complex logic, analysts can build end-to-end BI reporting systems without writing code. These tools are not just a replacement for Power BI and Excel but an evolution that reflects how people should actually work with their data in modern analytics: fast, exploratory, and iterative.
In this blog post, we’ll compare Power BI vs Excel, discuss the their strengths, weaknesses, and how AI-powered spreadsheet tools are redefining how to work with data.
Power BI vs Excel: the limitations of Excel at scale
Excel is exceptionally effective in handling small to medium-sized analyses, but a messy Excel sheet begins to break down as data volume and complexity increase. It wasn’t built to handle millions of rows or multiple datasets effectively. Analysts often resort to workarounds, such as splitting files and manually aggregating data. These compromises make it hard to trust that insights are actually being drawn from complete and up-to-date data.
Excel struggles with automated data refreshes. Its reliance on manual data imports and formula-based logic slows down analyses. Data is still typically pulled through CSV exports, copy-paste workflows, or scripts that still require human oversight. This means that any change in schema or file structure can break formulas and lead to errors.
Modern analytics demand collaborative analytics platforms that streamline working with teams in real-time and seamlessly share insights. Excel’s file-based model makes collaboration inherently difficult. This leads to multiple versions of the same workbook being circulated across email threads and shared drives with no single source of truth.
Excel also offers an AI-powered chatbot as an add-on that enables users to “talk to their data.” However, when it comes to working with large datasets and the full context of your data, Excel AI falls short. These limitations present a fundamental mismatch between Excel and Power BI, as analysts are prompted to look for Excel alternatives to cater to modern data needs.
The solution Power BI offers
The best BI tools like Power BI were built to address the shortcomings of traditional spreadsheets in large-scale analytics. They provide a robust and more reliable way to work with data across an organization.
Power BI can connect directly to databases, data warehouses, and SaaS platforms. Instead of relying on manual uploads or file exports, they pull data from the source in real time or through an automated refresh. This ensures that dashboards reflect the most current state of the business, reduces the risk of stale data, and eliminates all forms of human effort in ensuring data is accurate. This ensures data is updated and increases trust in generating insights.
Unlike traditional spreadsheets, which require users to manually build and maintain charts without automatic formatting Excel features, visualization in Power BI is less complex. Users do not need to know how to create chart from Excel data; Power BI tools allow users to define metrics and dimensions once and then reuse them across multiple dashboards and reports.
Collaboration is one area where Power BI clearly outperforms Excel. Instead of relying on file-based sharing, Power BI provides a collaborative environment where dashboards can be published, accessed, and shared across teams. Users can also leverage Power BI export to Excel, which allows you to export your data in Excel (.xlsx) or CSV format. This significantly reduces version sprawl and ensures that all stakeholders are working from an aligned set of metrics.
Since reports are hosted in a shared workspace, updates to data or logic are reflected immediately for everyone, eliminating the need to create multiple copies of the same file or manually distribute updates via email or shared drives. It also offers access controls, permissions, and usage tracking to further improve reliability and accountability.
Why Excel users don’t make the leap
It may seem puzzling that many Excel users hesitate to move to Power BI, especially given how clearly it improves on spreadsheet automation and visualization. The challenge is not a lack of interest in better analytics or more efficient workflows. It lies in the friction created by how traditional BI tools are designed and adopted. For most users, the promise of Power BI is compelling, but the path to realizing that value introduces enough complexity and overhead to slow or even stall adoption.
To begin with, getting value out of Power BI requires users to grasp concepts that extend well beyond traditional spreadsheet workflows. Analysts have to learn data modeling, understand relationships between tables, and work within semantic layers; these are skills that many Excel users neither have nor have the time to develop. Tasks that feel simple in Excel, even without an Excel formula explainer, often involve multiple steps and a strong understanding of the underlying data model in BI tools. This operational overhead makes non-technical users struggle to use advanced functionalities in Power BI.
Generating insights from your data in Power BI is rarely immediate. Data sources must be connected, modeled, and validated before accurate dashboards can be built. This setup takes time and requires a certain level of technical expertise. It also requires additional setup to accommodate schema changes, new metrics, and evolving data needs. By extension, ownership shifts away from business users and toward centralized data or BI teams, hindering data accessibility across the organization.
More importantly, Power BI sacrifices one of the core qualities that makes Excel appealing to users, its flexibility. Excel allows users to easily open a file, experiment freely, and iterate in real time. In contrast, BI tools impose structured workflows that prioritize stability and governance. Even though this results in a more controlled environment, it sometimes feels too rigid for users already accustomed to the flexibility of Excel.
Although it is possible to connect spreadsheets in Excel to Power BI through a live connection, it still requires users to know how to use Power BI with Excel. You’d have to connect Excel to a Power BI dataset, query the dataset using PivotTables, and then the data remains governed in Power BI. It’s also possible to export data from Excel to Power BI using Power BI’s import feature.
The move from spreadsheets to BI tools may appear obvious on the surface, but in practice, it is rarely a simple decision. Organizations must weigh several factors, including the cost of adoption, the volume and complexity of their data, and the availability of technical expertise to implement and maintain these systems.
Quadratic: AI-powered spreadsheet and BI platform
Addressing the limitations of Power BI versus Excel requires a different approach, one that preserves the familiarity and flexibility of spreadsheets while delivering the interactive dashboards and automation typically associated with BI tools. The ideal solution allows users to work with data in a spreadsheet-like environment, yet build and share interactive reports without having deep technical expertise. This is where Quadratic comes in.
Quadratic is an AI-powered spreadsheet and business intelligence platform designed to bridge the gap between Excel and Power BI. It allows users to explore and manipulate data in a spreadsheet-like interface while building powerful interactive dashboards. It is intuitive to use, built to handle large and complex datasets, and eliminates much of the setup and maintenance overhead. At the same time, it enables seamless sharing and collaboration, allowing users to share insights seamlessly with team members and relevant stakeholders.
The primary appeal of Quadratic goes beyond its ability to handle advanced data tasks such as modeling, exploratory data analysis, and visualization. Its real differentiator is the built-in AI agents for analysis that enable users to perform these tasks with minimal manual effort. Instead of writing complex formulas or code, users can simply describe what they want and leverage LLMs for data analysis.
AI-powered data analysis
With Quadratic, users can perform complex analysis on their data by using text prompts. Being a coding spreadsheet, Quadratic preserves flexibility for more advanced workflows, allowing users to work directly with formulas or write code in Python, SQL, or JavaScript. This makes it the ideal solution for non-technical users, technical users, and citizen developers.
Unlike Power BI, Quadratic does not require lengthy installations or complex setup processes. Users can connect directly to their data sources and begin analyzing data immediately. Let’s see how this works. We start by loading our data into Quadratic:
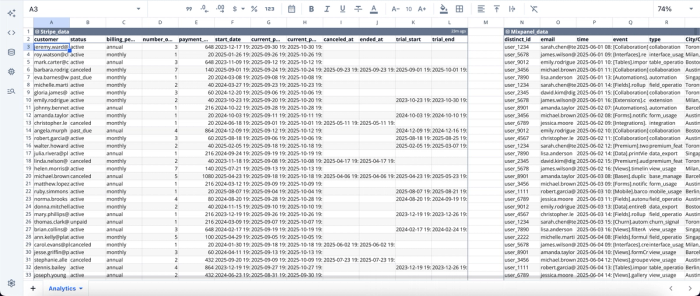
Here, we connected two data sources (Mixpanel and Stripe), and it immediately loads in Quadratic’s interface. Quadratic connects directly to raw data, databases, and APIs. Now that it has been loaded, we can then proceed to the analysis. Remember, all we have to do is ask. Suppose we want to get insights into website traffic:
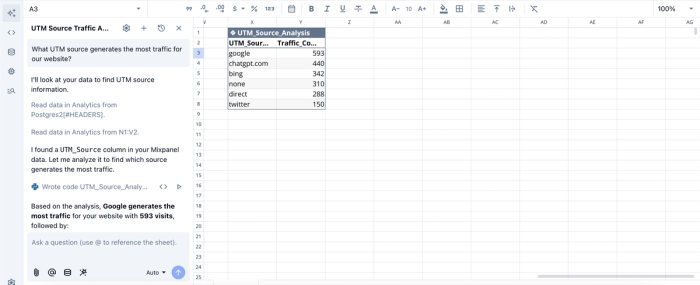
In this example, I ask Quadratic’s AI, “What UTM source generates the most traffic for our website?” Within seconds, it returns a clear breakdown of the top traffic-driving sources. There is no need to write complex formulas or manually define logic; just describe what you want using text prompts.
Even more importantly, the results remain dynamic. As the underlying data changes, Quadratic automatically updates the analysis without requiring any manual intervention. This eliminates the need to revisit formulas or manually maintain logic over time.
Speed in data preparation tasks
Quadratic is designed for speed and seamless iteration across every stage of the data analytics lifecycle. It simplifies and accelerates data exploration, cleaning, analysis, and visualization, all without using specialized data wrangling tools. By reducing the time spent on data transformation, teams can move more quickly from raw data to meaningful insights.
With built-in AI assistance removing many of the barriers associated with both Excel and Power BI, users can confidently work with their data and self-serve analytics. From the moment a data source is connected, Quadratic provides guidance and automation at each step.
Visualizations and dashboard creation
Creating an Excel dashboard without an Excel AI graph generator requires figuring out logic and combining formulas, while achieving these capabilities in Power BI requires significant setup and technical expertise. Quadratic removes this trade-off entirely. It enables users to build end-to-end BI reporting systems and interactive visualizations directly from their data using different chart types.
Instead of manually configuring visuals or having to learn Python, users simply describe how they want their data presented in plain language, and Quadratic generates the appropriate visualization automatically. This approach allows teams to access the full power of business intelligence without having to become BI experts. Let’s see how this works:
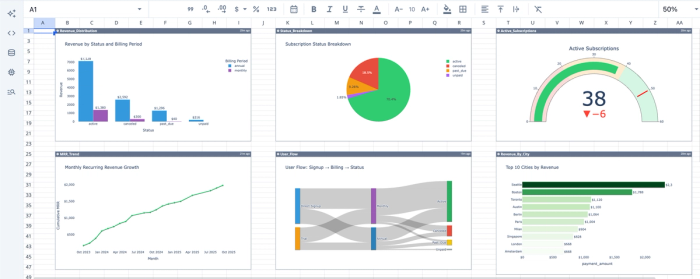
In this example, I prompt Quadratic with “Create visualizations for revenue distribution, subscription status, MRR trend, user flow, and revenue by city.” In seconds, Quadratic generates a set of interactive visualizations that track each of these metrics, all without writing code. See how you can create a dashboard in Python with AI.
Users can create visualizations for various fields such as finance, sales, and marketing. Once created, these visualizations can then be shared seamlessly with team members.
Excel vs Power BI vs Quadratic
In this section, we’ll see how Power BI, Excel, and Quadratic compare, helping you choose the best data analysis tools for your workflow.
| Metric | Excel | Power BI | Quadratic |
|---|---|---|---|
| Learning curve | Easy to use for basic analysis, can get complex with advanced analysis | Steep learning curve; requires technical expertise | Easy to use; spreadsheet-first with AI assistance |
| Live data connections | Limited, mostly manual exports | Native support for live and scheduled connections | Native live connections to databases and SaaS tools |
| Scalability | Performance degrades with large data | Can handle large datasets | Designed to handle large datasets efficiently |
| End-to-End BI Capability | Not supported | Fully supported | Fully supported without BI expertise |
| Collaboration & Sharing | Weak; comes with file-based versioning issues | Strong, centralized, and governed | Strong, real-time collaboration with a single source of truth |
| Visualization & Dashboards | Can build basic charts but not dashboards | Can build advanced interactive dashboards | Advanced visualizations and dashboards generated via plain language |
| Automation & Refresh | Mostly manual | Automated refreshes with setup | Fully automated with minimal configuration |
Conclusion
Spreadsheets and BI tools are rapidly converging, driven by a growing demand from Excel users for greater scale, automation, and visualization. While BI tools promise these capabilities, the reality is that making the transition is often far more complex than expected. This gap has created a clear need for an AI-powered solution that bridges the familiarity of spreadsheets with the power of business intelligence.
In this post, we examined Power BI vs Excel, discussing the limitations of spreadsheets at scale, the advantages BI tools bring, and the reasons adoption is not always straightforward. We also explored how Quadratic brings these worlds together as an AI tool for data analysis, enabling users to access BI functionality without deep technical expertise.
Ultimately, getting the most value from your data is not about mastering concepts in Power BI or Excel. It is about using a tool that removes those barriers entirely. Quadratic enables teams to work faster, leverage AI for business intelligence, and build powerful analytics without becoming BI experts. Try Quadratic for free today.
Frequently asked questions (FAQs)
Is Power BI better than Excel for data analysis?
Yes, Power BI is better than Excel for business data analysis. It offers additional features like live data connections, automated dashboards, and organization-wide reporting. However, Excel remains more flexible and easier to use for quick exploration and simple data needs. The best choice ultimately depends on the size of the data and available technical expertise.
What is Quadratic and how is it different from Excel and Power BI?
Quadratic is an AI spreadsheet analysis tool that combines the familiarity of Excel with the scale and automation of BI tools like Power BI. It allows users to analyze data, build dashboards, and generate visualizations using plain-language prompts, without requiring deep technical or BI expertise.
How can I build dashboards in Excel?
Building dashboards in Excel is possible using its native features, but it requires setup and continuous maintenance. To leverage data visualization in Excel, Users must first structure their data correctly, apply transformations where necessary, and rely on PivotTables as the foundation for analysis.
Can I build BI dashboards without technical skills?
Yes. AI-powered tools like Quadratic allow users to build end-to-end BI dashboards without writing code or learning complex BI concepts. By using natural language prompts and automated workflows, users can explore data, create visualizations, and share insights quickly.