
Table of contents
- The fundamentals: moving beyond the basic annuity valuation formula
- Building a unified annuity valuation calculator in Quadratic
- Real-world analysis 1: the lottery payout (lump sum vs. annuity)
- Real-world analysis 2: sizing a scholarship endowment (growing perpetuities)
- Why Excel and Python work better together
- Conclusion
- Use Quadratic to do annuity valuation
Major financial decisions boil down to the time value of money. Whether you are funding a scholarship, planning a retirement, or deciding what to do with a lottery jackpot, getting the math right is critical for long-term wealth. At the core of these decisions is annuity valuation. Analysts often face a frustrating choice when modeling these scenarios.
Basic spreadsheets are great for simple math and tabular data entry but struggle with complex simulations. Python is excellent for running detailed simulations but lacks the intuitive, quick data entry of a spreadsheet. This article explores a real-world workflow using Quadratic, an AI-powered spreadsheet that combines standard formulas, Python scripts, and data visualizations in a single workspace.
The fundamentals: moving beyond the basic annuity valuation formula
Before diving into advanced models, it is helpful to review the foundational concepts of the time value of money. Present value, future value, and the compound annual growth rate form the basis of most financial projections. The standard annuity valuation formula allows you to calculate the current worth of a series of equal payments made at regular intervals. A standard annuity has a fixed end date, while a perpetuity continues indefinitely.
However, knowing the underlying mathematics is only the first step. Real-world financial decisions rarely exist in a vacuum. Dynamic factors like fluctuating tax rates, changing interest environments, and unpredictable inflation quickly break traditional calculators. To make accurate decisions, you need a modeling environment that can handle dynamic, multi-variable scenarios without crashing or requiring constant manual updates.
Building a unified annuity valuation calculator in Quadratic
Evaluating large monetary choices requires placing structured financial data right next to advanced computational logic. In a typical workflow, a financial analyst might build an annuity valuation calculator to assess these trade-offs. Quadratic is uniquely suited for this task because it functions as a unified workspace. Users can rely on standard spreadsheet formulas for quick present value calculations while simultaneously running Python scripts in adjacent cells for advanced simulations.
This allows you to set up your structured inputs, like interest rates and payment schedules, in a familiar grid. Instead of exporting that data to a separate coding environment, you can reference those exact cells using native Python to generate complex outputs and visualizations directly alongside your data.
Real-world analysis 1: the lottery payout (lump sum vs. annuity)
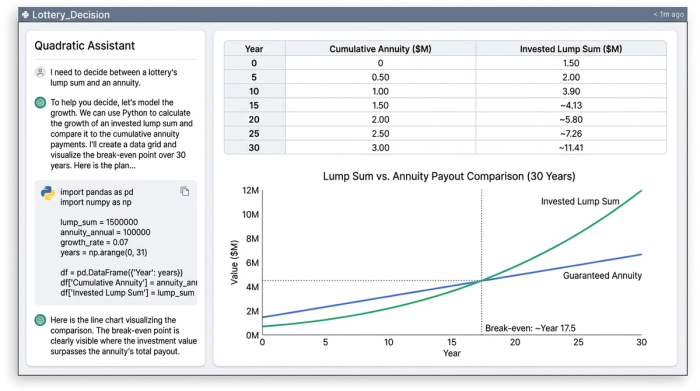
Consider the classic scenario of winning the lottery. You are faced with a massive choice of taking an immediate lump sum or annuity payout. In Quadratic, you can structure the annuity payments directly into the spreadsheet grid. Using standard financial functions, you can quickly calculate the implied interest rate of the offered annuity contract.
From there, the analysis becomes more complex. What if you take the lump sum and invest it in the market? By writing a brief Python script in a neighboring cell, you can model alternative investment returns over that same 30-year period, factoring in historical market yields and estimated taxes. Because Quadratic supports native visualizations, you can instantly plot the break-even point. Seeing the two growth curves side by side provides immediate clarity on which option yields the highest long-term value.
Real-world analysis 2: sizing a scholarship endowment (growing perpetuities)
Another common financial challenge is structuring an endowment. If a donor wants to fund a university scholarship forever, the analysis shifts from a standard timeline to a growing perpetuity. This requires defining specific parameters like the initial scholarship amount, the expected annual inflation rate, and the projected portfolio yield. Calculating the present value of a growing perpetuity ensures the principal amount will generate enough interest to cover the scholarship year after year, even as costs rise.
The advantage of using a tool like Quadratic for this workflow is the interactivity. You can adjust the expected inflation rate in a single cell and watch as the Python-driven perpetuity model instantly updates the upfront capital required. This immediate feedback loop bridges the gap between static data entry and dynamic financial forecasting.
Real-world analysis 3: dynamic retirement planning
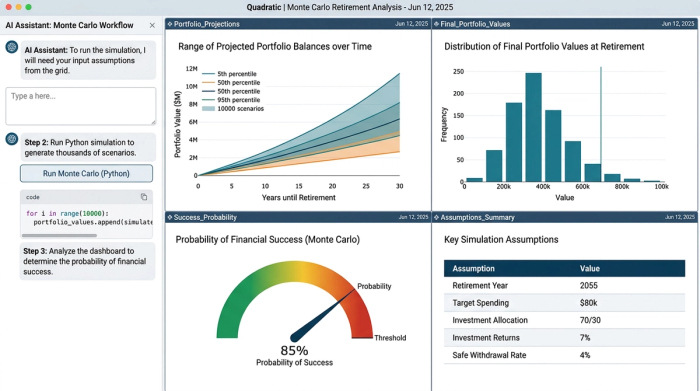
Retirement planning introduces even more variables. Unlike a simple lottery payout, retirement consists of two distinct phases. You have the accumulation phase where you are saving, and the decumulation phase where you are withdrawing funds. To accurately determine retirement timing, you need to account for savings contributions, withdrawal rates, and variable investment returns.
In Quadratic, you can utilize Python to run complex loop simulations, such as Monte Carlo analyses, based directly on your spreadsheet inputs. By running thousands of return scenarios, you can determine the probability of your savings lasting through retirement. The resulting outputs are formatted clearly within the spreadsheet grid. This bridges the gap between a highly complex Python script and an executive-friendly report, making it easy to interpret the data and adjust your savings strategy accordingly.
Why Excel and Python work better together
Financial modeling often forces a compromise. You typically have to choose between the accessibility of a spreadsheet and the analytical power of code. By combining standard formulas, SQL, and Python in a single browser-based canvas, you no longer have to make that choice.
In the workflows described above, comparing alternatives, calculating implied rates, and visualizing data happened much faster because there was no need to switch contexts. You do not have to copy and paste data between a basic calculator and a separate programming environment. Everything lives in one place, keeping logic, context, and outputs tightly aligned.
Conclusion
Accurate annuity valuation is a cornerstone of high-stakes financial planning. Whether you are evaluating the payout of a winning lottery ticket, managing a perpetual university endowment, or mapping out a dynamic retirement strategy, getting the numbers right is essential. The right tooling makes all the difference in understanding these complex trade-offs. By bringing advanced computations directly into a familiar grid, you can analyze data with greater speed and clarity. Try building your own financial models and calculators in Quadratic to experience the combined power of Python and spreadsheets for your next major financial decision.
Use Quadratic to do annuity valuation
- Use both standard formulas and Python scripts in one grid for precise annuity calculations and complex simulations.
- Accurately model dynamic factors like fluctuating interest rates, inflation, and taxes in real-world annuity scenarios.
- Compare lottery lump sum vs. annuity payouts by simulating alternative investment returns and visualizing break-even points side-by-side.
- Interactively size growing perpetuities and endowments, with Python models instantly updating capital requirements as inputs change.
- Perform advanced retirement planning, running Monte Carlo simulations directly from your spreadsheet inputs to assess long-term viability.
- Keep all your financial data, analytical logic, and visualizations in a single, unified workspace, avoiding context switching.
Ready to build your own financial models? Try Quadratic.