
Table of contents
- Understanding the mechanics of growth
- Why web widgets and static spreadsheets fall short
- Tutorial: Building a dynamic compound interest calculator
- Analyzing your financial future (sensitivity analysis)
- Visualizing the "hockey stick" curve
- Start modeling your wealth today
- Use Quadratic to build a dynamic compound interest calculator
Compound interest is frequently cited as the primary engine of wealth creation, often described as the "eighth wonder of the world." For investors and savers, the concept is simple: your money earns interest, and that interest earns interest. However, accurately forecasting how your current savings will grow over ten, twenty, or thirty years is surprisingly difficult when relying on standard tools.
Most people start their journey by searching for a basic compound interest calculator. These web-based widgets provide a quick snapshot, but they are often disconnected from reality. They rely on static inputs—guesses about your bank balance or contribution ability—that become outdated the moment you close the browser tab. True financial planning requires a living model, not just a one-time calculation.
To truly take control of your financial future, you need a tool that evolves with your finances. By building a dynamic calculator in Quadratic, you can connect directly to your live bank balances, use Python to run precise growth projections, and model different market scenarios. This moves you beyond simple estimation into the realm of professional financial modeling.
Understanding the mechanics of growth
Before building a complex model, it is essential to understand the underlying mathematics. At its core, interest is the cost of using money. Simple interest is calculated only on the principal amount. Compound interest, however, is calculated on the principal plus the accumulated interest from previous periods. This creates a snowball effect where growth accelerates over time.
To understand how to calculate compound interest, you must identify four key variables:
- Principal (P): The initial amount of money you start with.
- Rate (r): The annual interest rate (expressed as a decimal).
- Time (t): The number of years the money is invested.
- Frequency (n): The number of times that interest is compounded per year.
The standard formula used to determine the future value of an investment is: $A = P(1 + r/n)^{nt}$
While the math is straightforward, the application can be complex. When asking "how do we calculate compound interest" for a real-world portfolio, you must account for variables that change, such as monthly contributions that increase with inflation or interest rates that fluctuate based on market conditions.
Why web widgets and static spreadsheets fall short
If you search for a tool to project your savings, you will likely find the NerdWallet compound interest calculator or similar tools from Investor.gov. These widgets are excellent for beginners who need a rough estimate. However, for a serious DIY investor or financial analyst, they present a "black box" issue. You cannot see the underlying math, you cannot save your specific scenario for later, and you cannot layer in complex variables like tax drag or changing contribution rates.
Traditional spreadsheets like Excel or Google Sheets offer more transparency but suffer from the "dead data" problem. You might build a robust model, but it requires manual data entry. By the time you finish inputting your starting balances across high-yield savings accounts and brokerage portfolios, the market has moved, or you have made a new deposit, rendering your starting principal obsolete.
Quadratic solves these limitations by combining the flexibility of a spreadsheet with the power of Python and live data integrations. Instead of a static snapshot, you build a connected workspace where your starting principal updates automatically, and your projections are handled by scriptable logic rather than fragile chains of spreadsheet formulas.
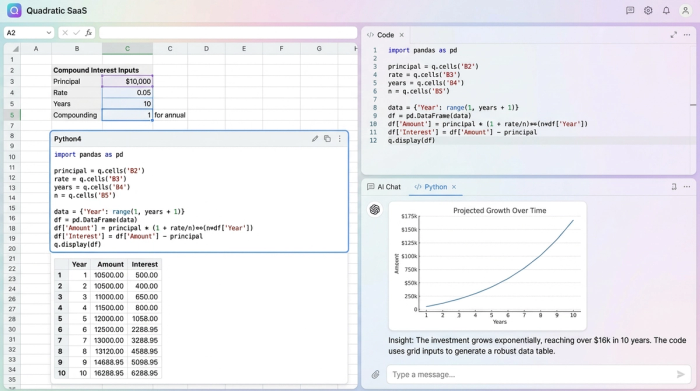
Tutorial: Building a dynamic compound interest calculator
Building a personalized financial model in Quadratic allows you to tailor the output to your specific goals. Here is how you can move beyond a standard web widget and construct a calculator that updates itself.
Step 1: Connect live data
The accuracy of any projection depends on the quality of the inputs. In a standard spreadsheet, you would manually type your current savings balance into a cell. In Quadratic, you can automate this.
Using built-in data integrations, you can pull live balance data from your financial institutions or import a CSV export from your bank. This ensures that your "Starting Principal" variable is always accurate. Every time you open your sheet to review your progress, the calculator uses your actual real-time net worth as the baseline for future growth.
Step 2: Define your variables
Once your live balance is connected, you need to set up the assumptions that will drive the model. Create a dedicated section on the grid for your inputs:
- Monthly Contribution: The amount you plan to add to your savings.
- Annual Return Assumption: A conservative estimate of market performance (e.g., 7%).
- Years to Grow: Your time horizon.
- Compounding Frequency: How often the interest is applied.
This is where you can build in flexibility that web widgets lack. For example, high-yield savings accounts often compound daily, while bonds might compound semi-annually. You can create a toggle to switch between a monthly view or a daily compound interest calculator to see how frequency impacts the final number.
Step 3: The Python projection
In a traditional spreadsheet, calculating an amortization or growth schedule often involves dragging a complex formula down 360 rows (for a 30-year mortgage or investment). If you break the formula or drag it too far, the model breaks.
In Quadratic, you can use Python to calculate compound interest more elegantly. By referencing your input cells (Principal, Rate, Time) in a Python code block, you can write a simple loop that calculates the running balance for every month or day of the term.
The script can generate a clean dataframe—a structured table—that lists the date, the interest earned that period, the contribution added, and the new ending balance. This method is faster, less prone to user error, and instantly generates the full schedule regardless of whether you are projecting 5 years or 50 years.
Analyzing your financial future (sensitivity analysis)
A single number is rarely enough to base a financial decision on because the future is uncertain. You might expect an 8% return, but what if the market only delivers 5%? You might plan to contribute $500 a month, but what if you can stretch that to $750?
Advanced modeling requires sensitivity analysis—testing how changes in variables impact the outcome. Because Quadratic handles data natively, you can easily create a sensitivity matrix (often called a data table or heatmap).
You can set up a table where the rows represent different contribution amounts and the columns represent different interest rates. Using your Python logic, the sheet can fill in the matrix to show the final portfolio value for every combination. This allows you to visualize a range of outcomes on a single canvas, helping you understand which variables have the biggest impact on your wealth.
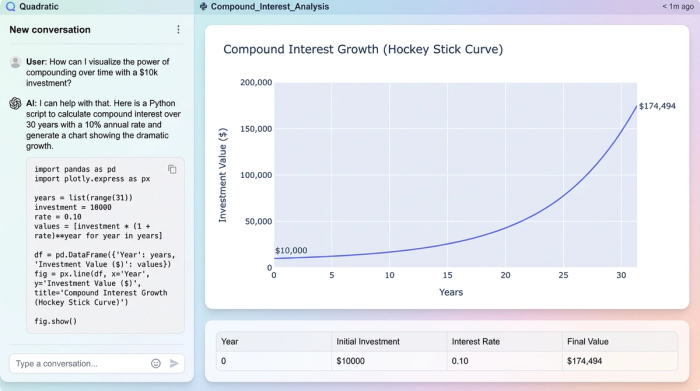
Visualizing the "hockey stick" curve
Numbers in a grid are useful, but visualizing the data is what makes the concept of compounding click. The famous "hockey stick" curve demonstrates that in the early years, growth feels linear and slow. It is only in the later years that the exponential nature of compounding takes over, where the interest earned exceeds your annual contributions.
Using the data generated by your Python script, you can plot the growth trajectory directly in Quadratic. Unlike static calculators, this chart is linked to your live data and variables. If you change your return assumption from 6% to 8%, the chart updates instantly, showing you exactly how that small percentage change results in a massive difference in the final years of the accumulation phase.
Frequently asked questions
Does compounding frequency matter?
Yes, frequency affects the total return. A daily compound interest calculator will show a slightly higher final balance than one that compounds annually, because interest is being added to the principal every day. While the difference is small in the short term, it adds up over decades.
How do I calculate compound interest with varying contributions?
Standard formulas assume a constant contribution. If you want to model increasing contributions (e.g., increasing your savings rate by 3% annually to match salary raises), you cannot use a simple calculator. You need a custom model like the one described above, where Python logic can increment the contribution amount year over year.
What is the difference between a savings calculator and a compounding interest calculator?
They are often the same, but a "savings calculator" implies simple linear accumulation, whereas a compounding interest calculator explicitly accounts for the reinvestment of earnings.
Start modeling your wealth today
Wealth building is not a one-time calculation; it is a discipline that requires tracking and adjusting over time. Relying on static web widgets gives you a glimpse of the future, but building a personal financial model gives you a roadmap.
By moving your planning into Quadratic, you transform a static math problem into a dynamic system. You can connect your real assets, run sophisticated scenarios using Python, and visualize your path to financial independence with clarity.
To start building your own model, you can use a financial forecast template in Quadratic or open a new sheet to connect your data and write your first projection script today.
Use Quadratic to build a dynamic compound interest calculator
- Connect live financial data to automatically update your starting principal, ensuring your projections always reflect your real-time net worth.
- Model complex scenarios by defining flexible variables for contributions, return assumptions, and compounding frequencies, going beyond static web widgets.
- Run robust growth projections using Python scripts to calculate running balances for any time horizon, eliminating fragile spreadsheet formulas and manual errors.
- Perform comprehensive sensitivity analysis to understand how varying contributions, interest rates, and market conditions impact your long-term wealth.
- Visualize your financial future with dynamic charts that instantly update as you adjust variables, clearly showing the exponential power of compounding.
Stop relying on static calculators. Build a personal financial model that evolves with your finances. Try Quadratic